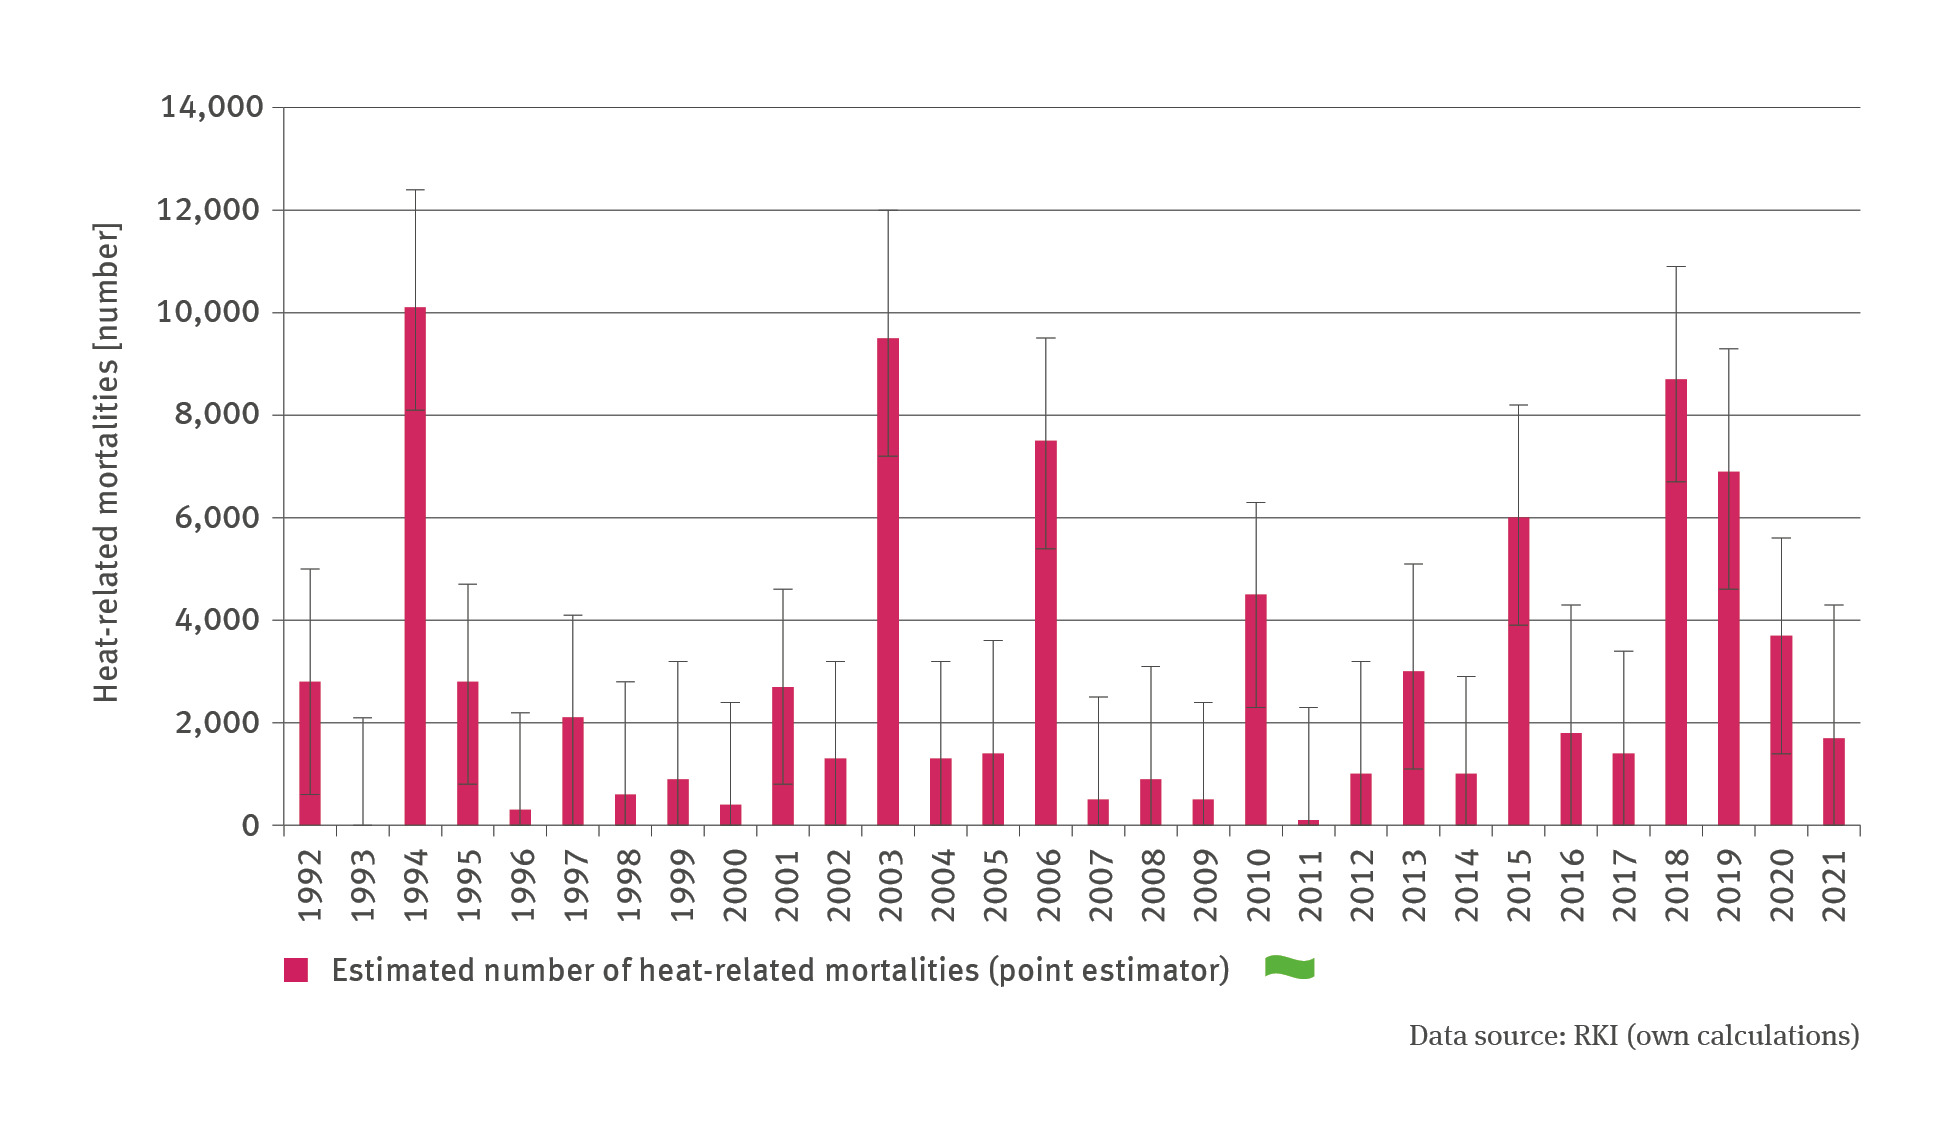
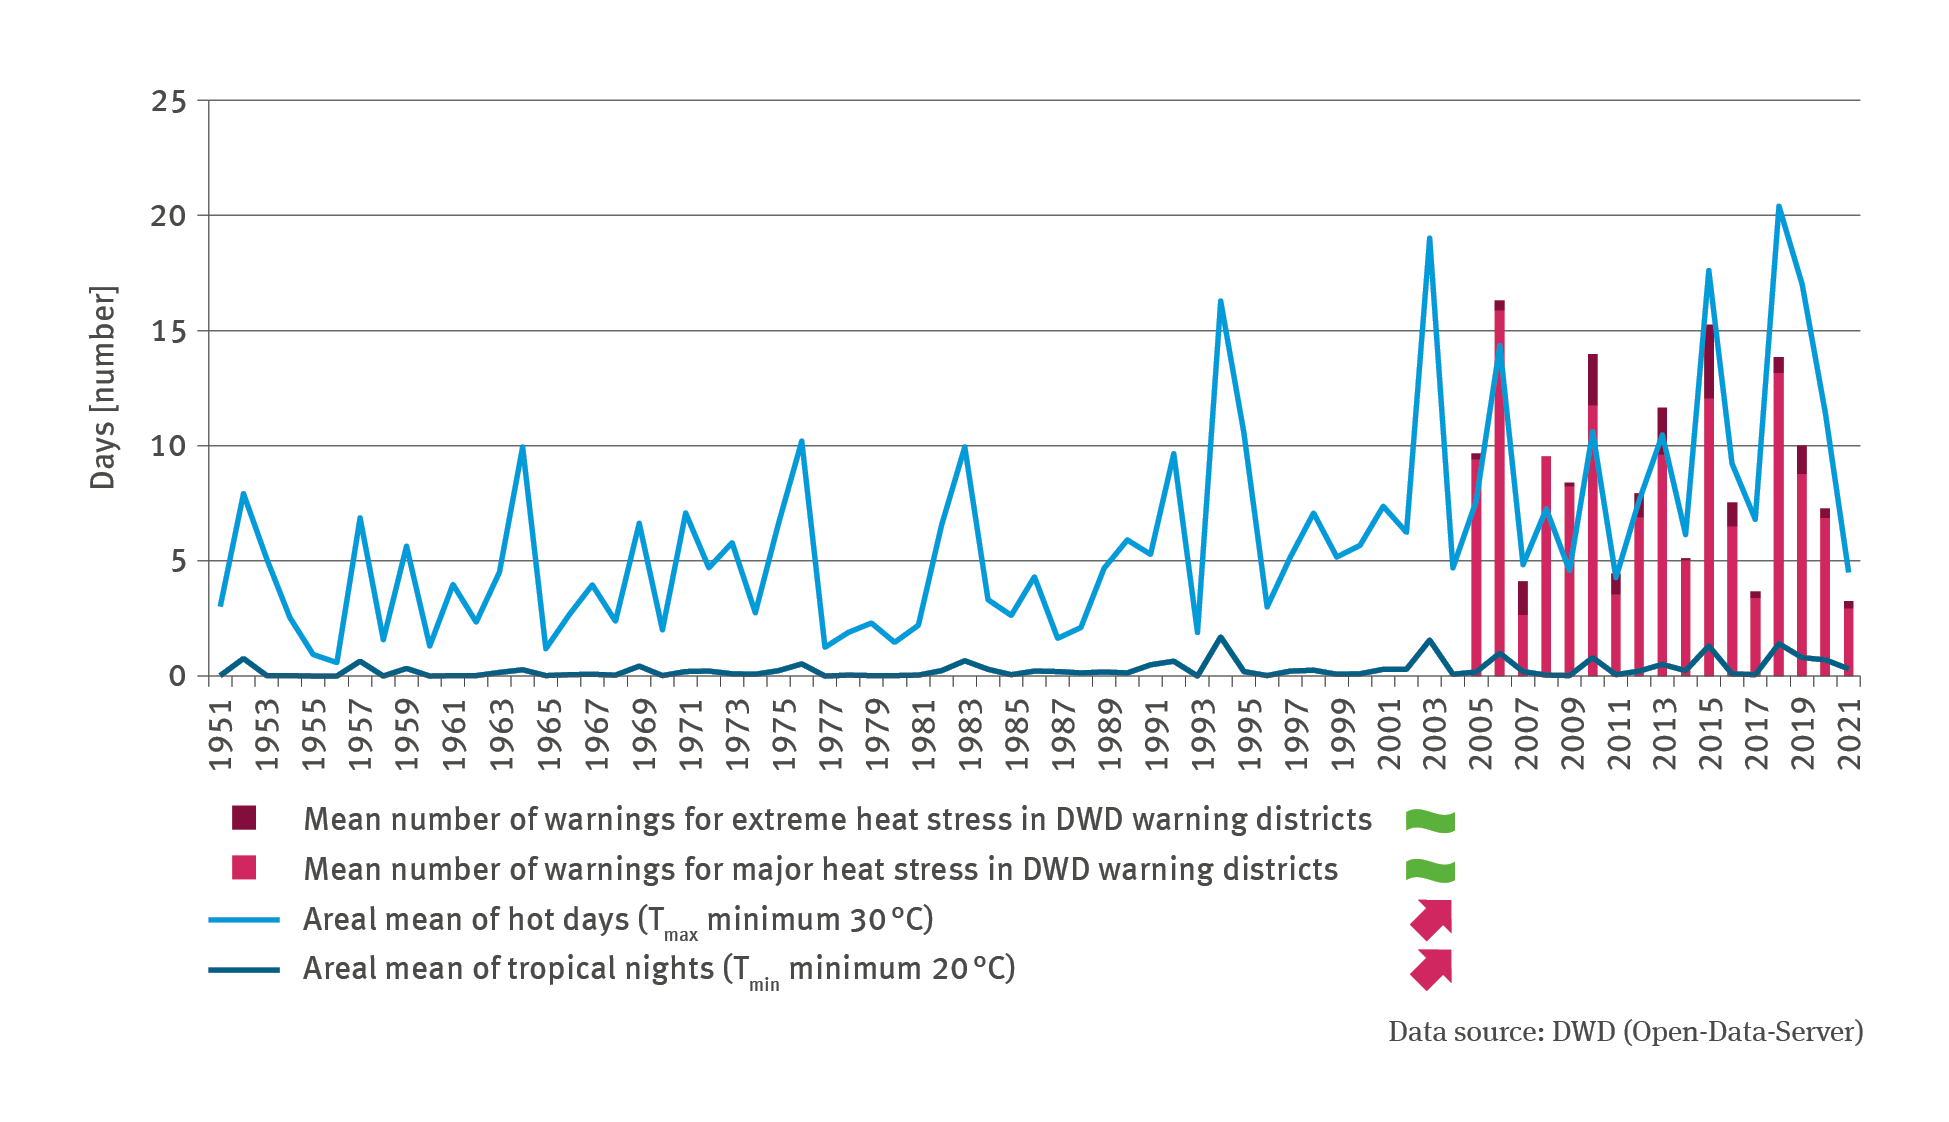
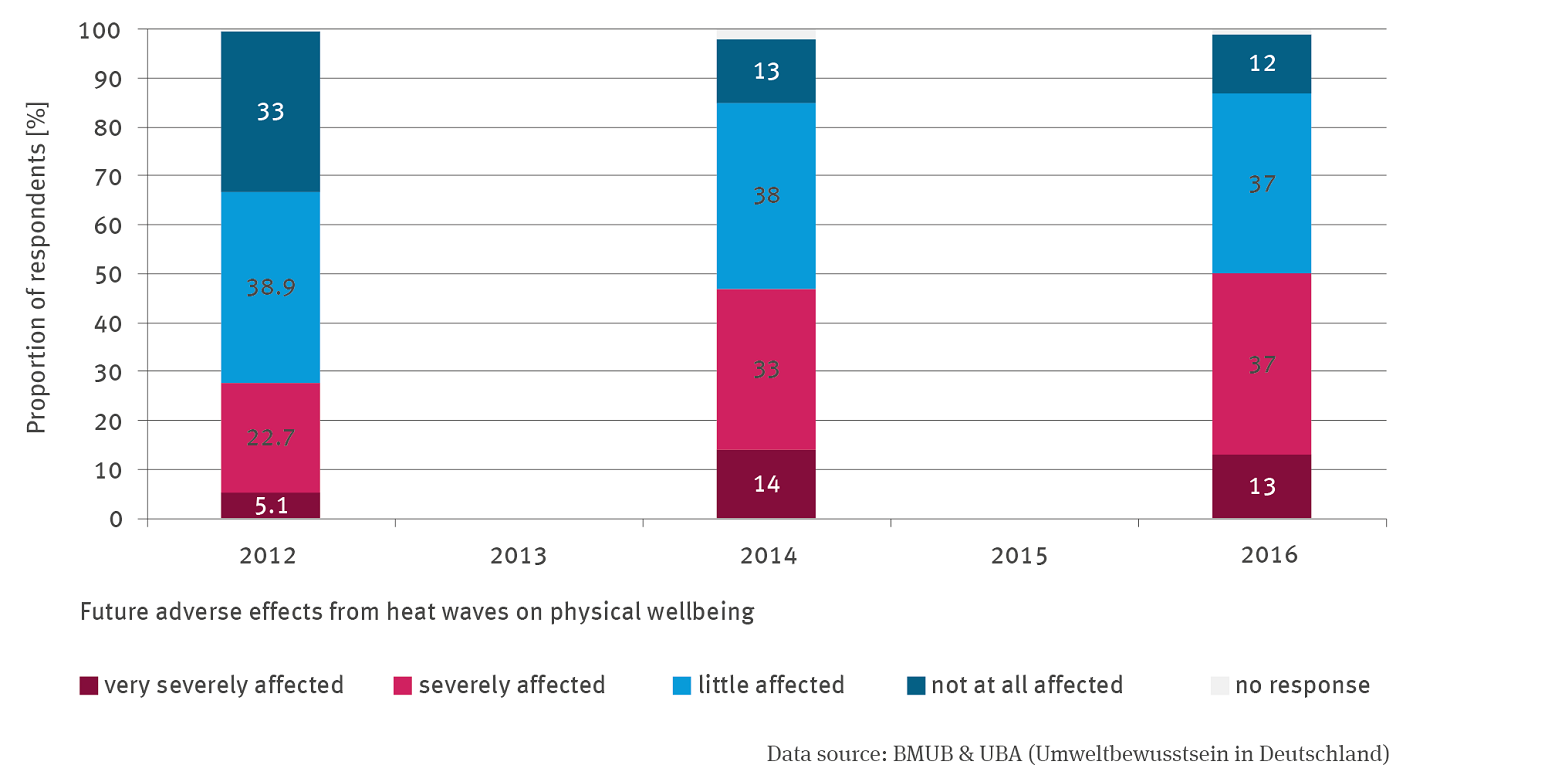
Data Search Data Search Here you will find diagrams, infographics, maps and tables for direct download. Data Search Data topics Show all Klima (132) Energie (23) Luft (19) Fläche, Boden, Land-Ökosysteme (23) Wasser (36) Chemikalien (4) (-) Umwelt und Gesundheit (23) Ressourcen und Abfall (9) Verkehr (16) Land- und Forstwirtschaft (32) Private Haushalte und Konsum (9) Umwelt und Wirtschaft (24) Data types (-) Show all Diagramme (23) Umwelt-Indikatoren (7) Infografiken (0) Karten (0) Daten und Tabellen (7) Refine your search Item language Show also German Reset The search resulted in 23 hits Sort by RelevanceChangedName Order AscDesc 11.12.2024 GE-I-2: Heat-related mortalities Klima Umwelt und Gesundheit Diagramme Export data PNG 11.12.2024 GE-I-1: Heat stress Klima Umwelt und Gesundheit Diagramme Export data PNG 09.08.2021 GE-I-1 (addendum): Public awareness of health problems due to heatwaves Klima Umwelt und Gesundheit Diagramme Export data PNG First page « Previous page ‹ Page 1 Page 2 Current page 3 of 3 Next page › Last page » You can also search in other data portals of the German Environment Agency


