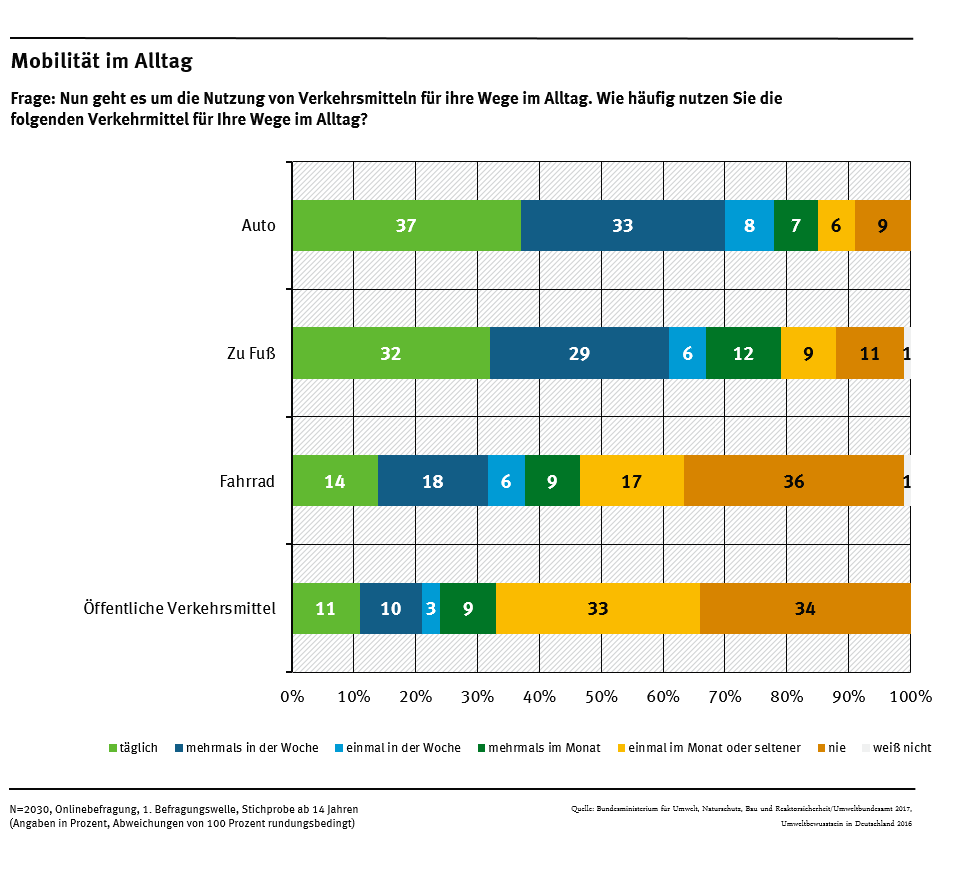
Prozentanzahl der Befragten, welche Verkehrsmittel sie für ihre alltäglichen Wege nutzen
Source: Umweltbundesamt
Download image (165.60 kB)
Prozentanzahl der Befragten, welche Verkehrsmittel sie für ihre alltäglichen Wege nutzen