Data Search


Infographic: Ambitious GHG mitigation opportunities and challenges in the agricultural sector
- Klima
- Land- und Forstwirtschaft
- Infografiken
Export data


Export data

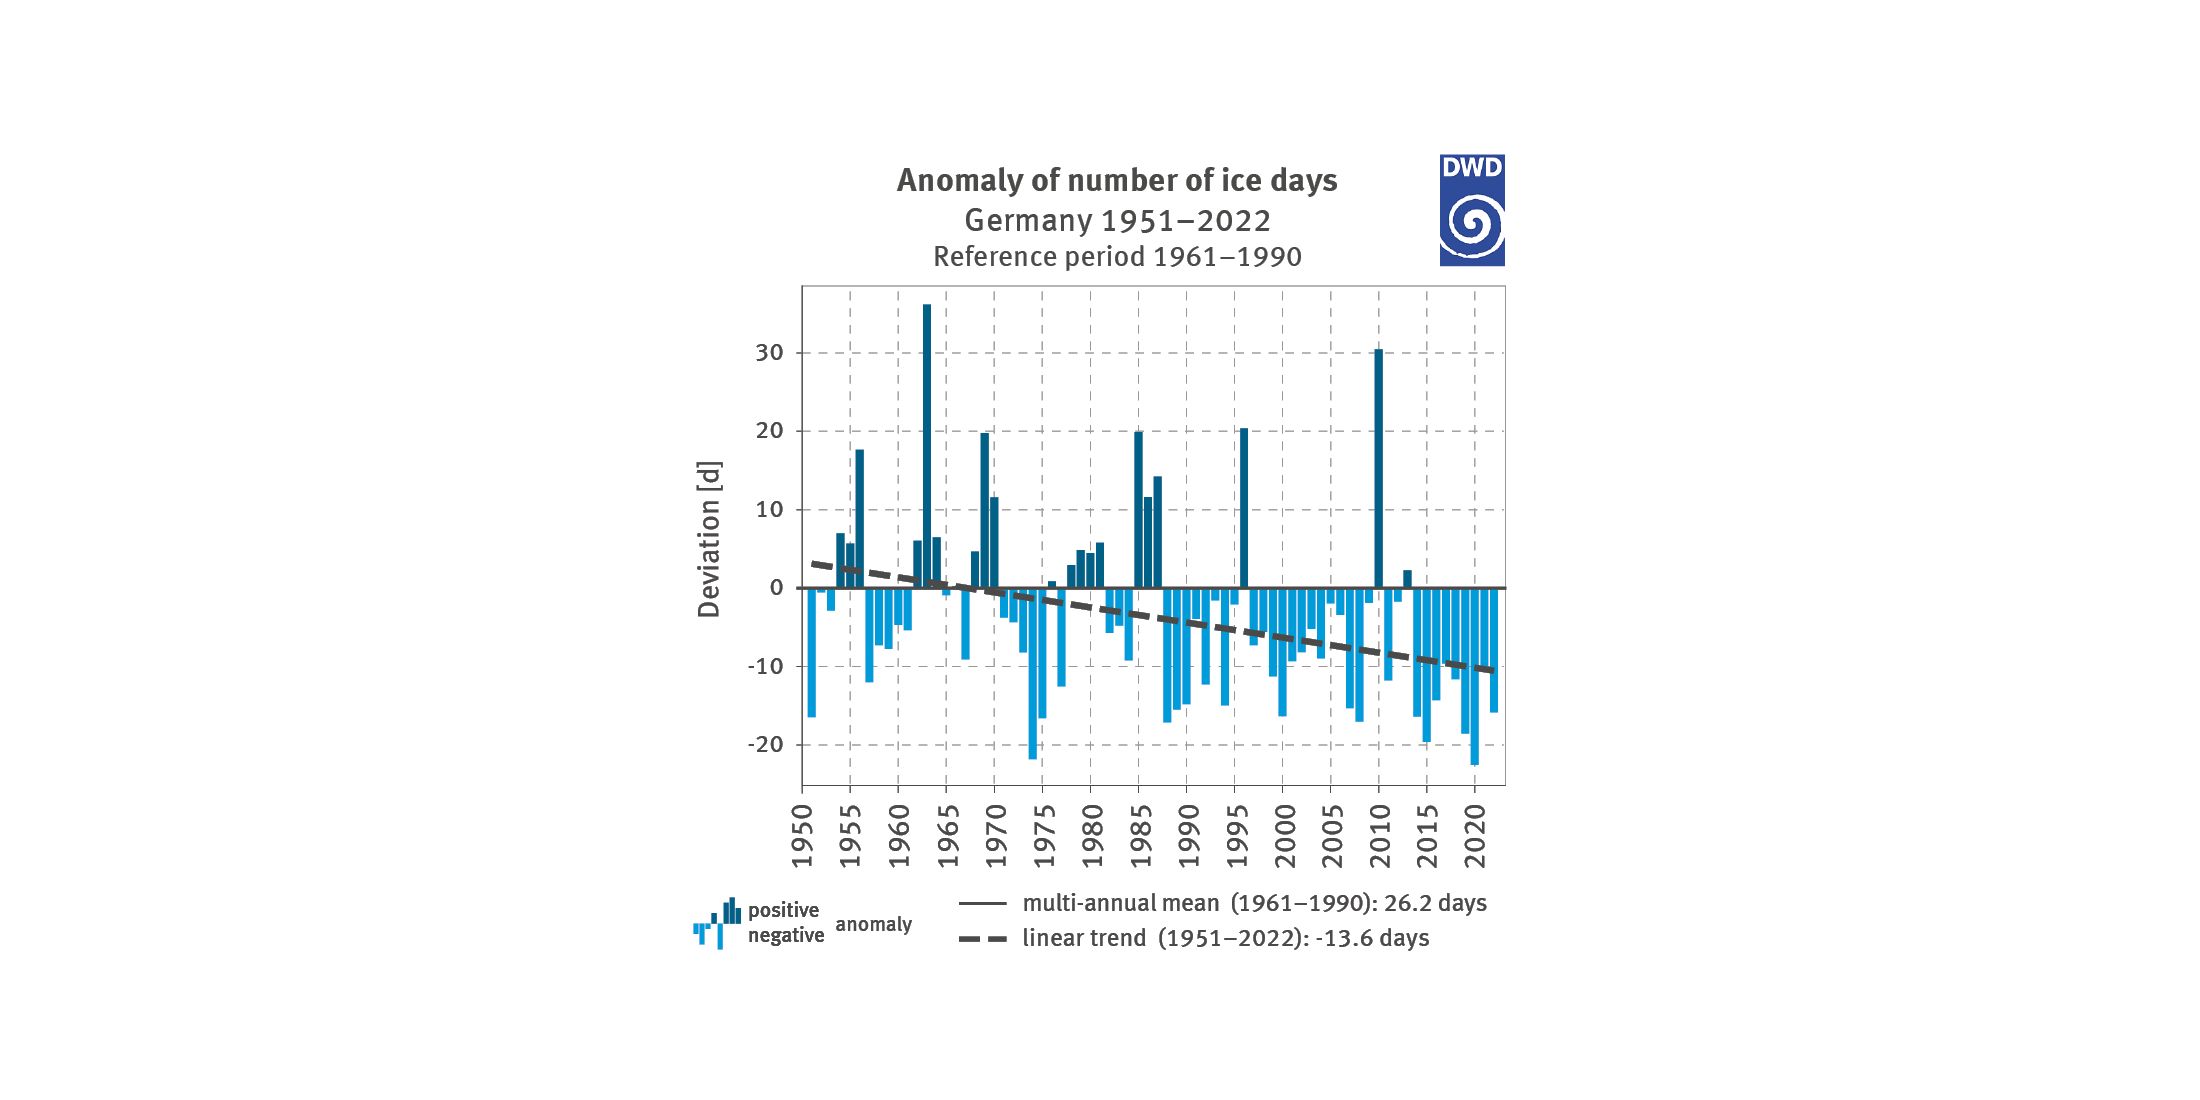
Figure 5: Deviation of the number of ice days (right) from the multi-annual mean 1961–1990
- Klima
- Diagramme
Export data

Figure 5: Deviation of the number of hot days for Germany from the multi-annual mean 1961–1990
- Klima
- Diagramme
Export data
