Appointment from 08.08.2025
Search
817 - 828 of 1382
-

-
Appointment from 11.09.2019 | Last changed: 12.12.2019
Conference on “Resource-Efficient Decarbonisation Pathways“
 … Berlin Deutschland Open in OpenStreetMap Monday, November 4th, 2019 - 12:00 until Tuesday, November 5th, 2019 - 16:15 Conference by the German Environment Agency …
 -
News from 03.09.2018 | Last changed: 21.02.2019
How environmentally friendly is UBA's mobility?
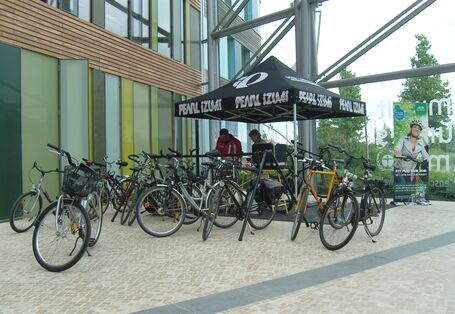 … The share of local and regional public transport has increased slightly since 2013. As a result, average CO 2 emissions per work week and employee have declined by 4.2 percent compared to 2013. We are making efforts to avoid business trips by holding telephone and video … said they took the train for domestic business trips – five percent more than in 2013. At UBA we have been implementing targeted measures for 12 years to promote …
 -
Document from
Hotels in the vicinity
… Hotels in the vicinity 19.11.2013 Document Hotels in the vicinity (260.26 kB) Tags veterinary drug … Hotels in …Hotels in the vicinity (260.26 kB) -
Image from | last change:
Figure 11: Annual mean number of days with a soil humidity
 … the following periods: 1963–1972, 1973–1982, 1983–1992, 1993–2002, 2003–2012 and 2013–2022. The range for the top row is spread over 5 equidistant categories from 0 … the following periods: 1963–1972, 1973–1982, 1983–1992, 1993–2002, 2003–2012 and 2013–2022. The range for the top row is spread over 5 equidistant categories from 0 …
 -
Document from
A list of recognised environmental associations
… A list of recognised environmental associations 19.07.2013 Document A list of recognised environmental associations (166.40 kB) … A list …A list of recognised environmental associations (166.40 kB) -
Press release 20/12 from 31.05.2012 | Last changed: 01.07.2013
Scope of information about chemicals improved
… Authorisation and Restriction of Chemicals) legislation entered into force on 1 June 2007. Press release No. 20/12 | 31.05.2012 Five years onward the achievements … Authorisation and Restriction of Chemicals) legislation entered into force on 1 June 2007. … Scope of information about chemicals improved … -
DzU article from 29.07.2025 | Last changed: 30.07.2025
Indicator: Taxes related to the environment
 … and Development (OECD) and the Statistical Office of the European Union (Eurostat 2013) . Reports on the development of environmental taxes are part of the … and Development (OECD) and the Statistical Office of the European Union (Eurostat 2013) . Reports on the development of environmental taxes are part of the …
 -
Appointment from 10.05.2021 | Last changed: 01.06.2021
Open consulation CODES: A Digital Planet for Sustainability
 … input to the planned CODES conference “A digital planet for sustainability” in late June. More information on CODES Tags sustainability … Open consulation CODES: A …
 -
Document from
Scientific Background Document B (SBD-B)
SBD-B (4.15 MB) -
Green procurement: Article / Tender recommendation / Environmental criteria from 17.04.2024 | Last changed: 24.06.2024
Bibliography and links
 … für Wirtschaft und Technologie an den Chef des Bundeskanzleramtes (Oktober 2013) Link Kommunale Beschaffung im Umbruch - Studie (2013) Herausgeber: Institut für den öffentlichen Sektor e.V. und KPMG AG Wirtschaftsprüfungsgesellschaft Link Umweltkennzahlen in der Praxis (Juli 2013) Herausgeber: Bundesministerium für Umwelt, Naturschutz und Reaktorsicherheit …
 -
Document from
Antibiotic resistance in the environment (Abstract)
… Antibiotic resistance in the environment (Abstract) 11.09.2013 Document Antibiotic resistance in the environment (Abstract) (143.22 kB) … …


