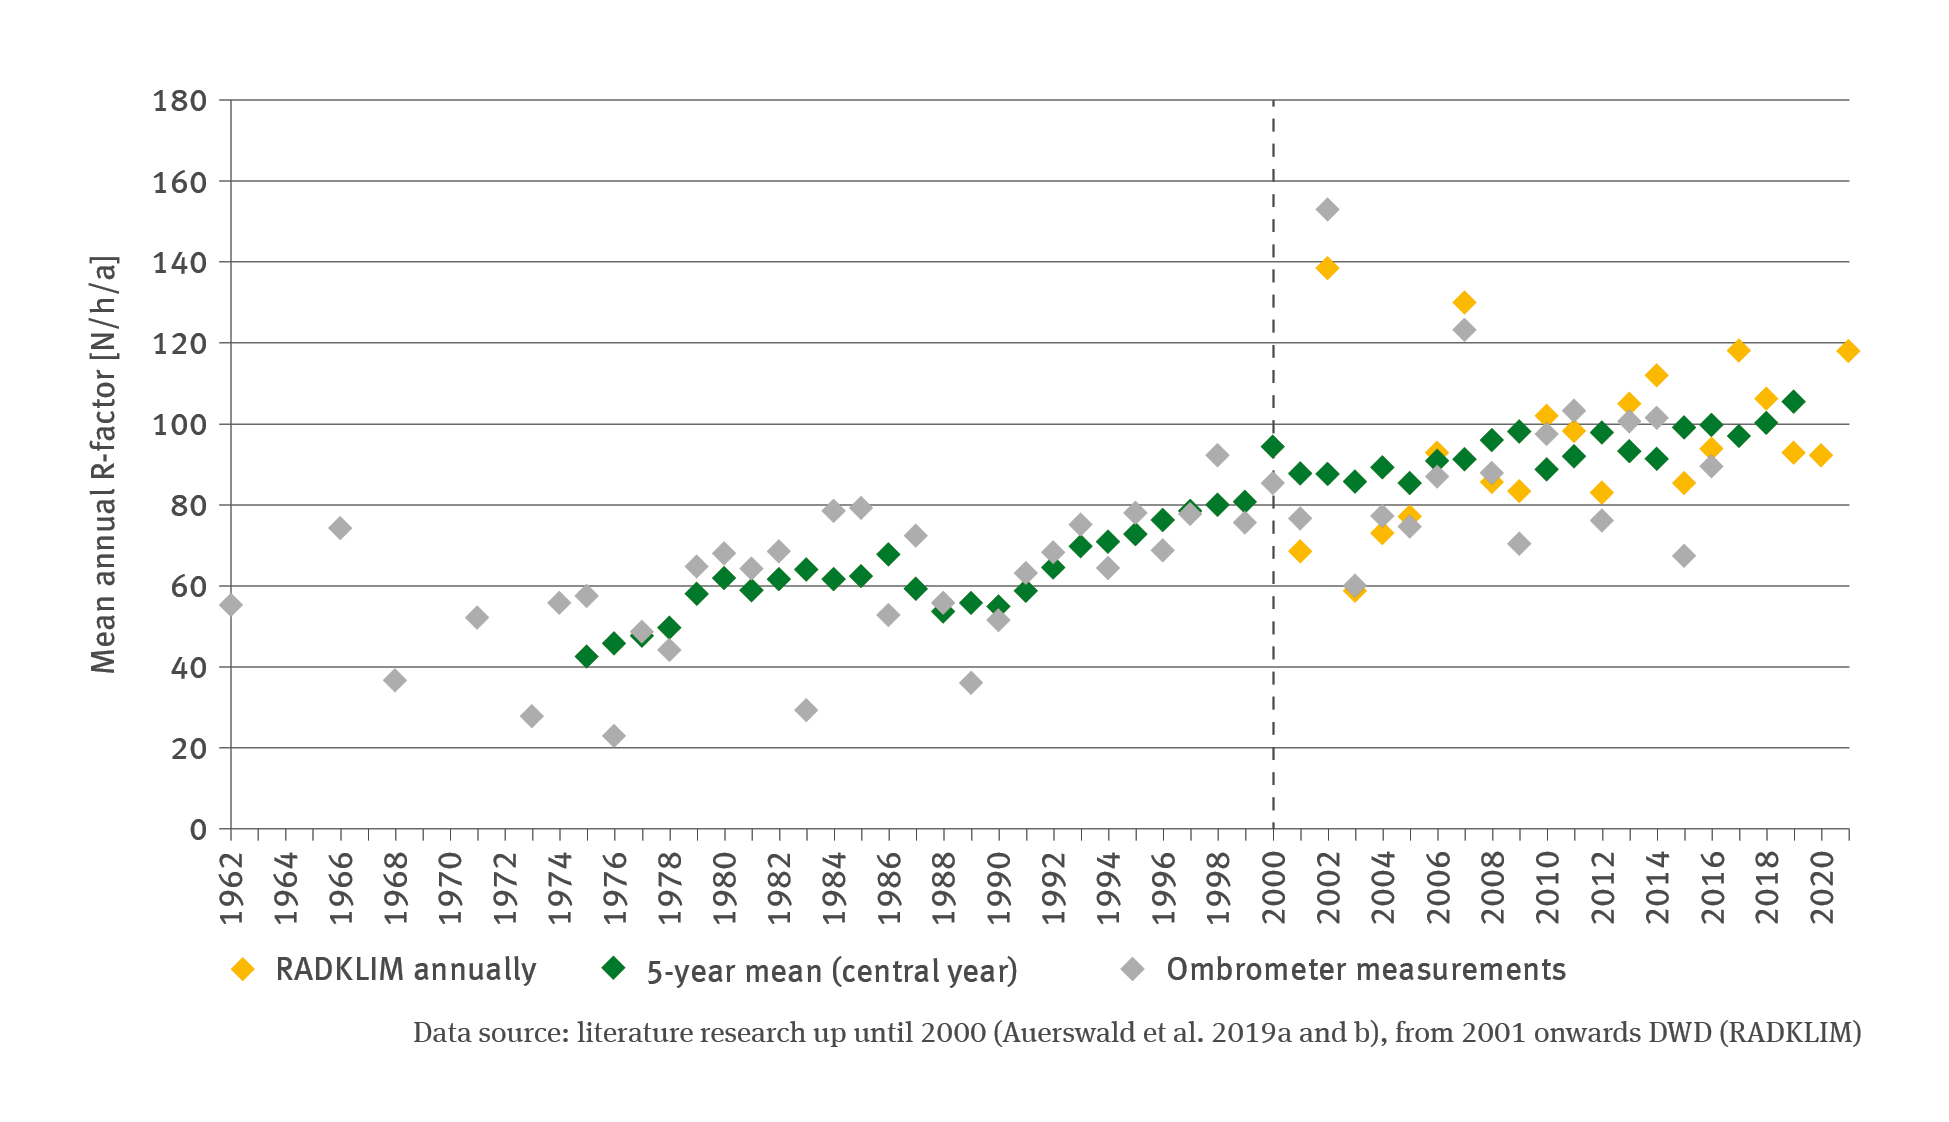
The illustration contains an XY scatter diagram which indicates the mean annual R-factor in Newton per hour. The illustration covers the period 1962 to 2021. The data emanate from ombrometer measurements (illustrated by grey dots), and from 2001 onwards additionally, the RADKLIM radar measurements (illustrated by yellow dots). Ombrometer measurements are not available for all years: at the start and the end of this time series, there are several years without such measurements. From 1975 onwards, there is also an illustration of a five-year mean in terms of green dots on the central year. A trend analysis was not carried out. However, for the period of 1975 to 2000, the five-year mean moves between 40 and 95 Newton per hour and per year, while in the period from 2001 to 2019, it moves roughly between 85 and 105 Newton per hour and year.