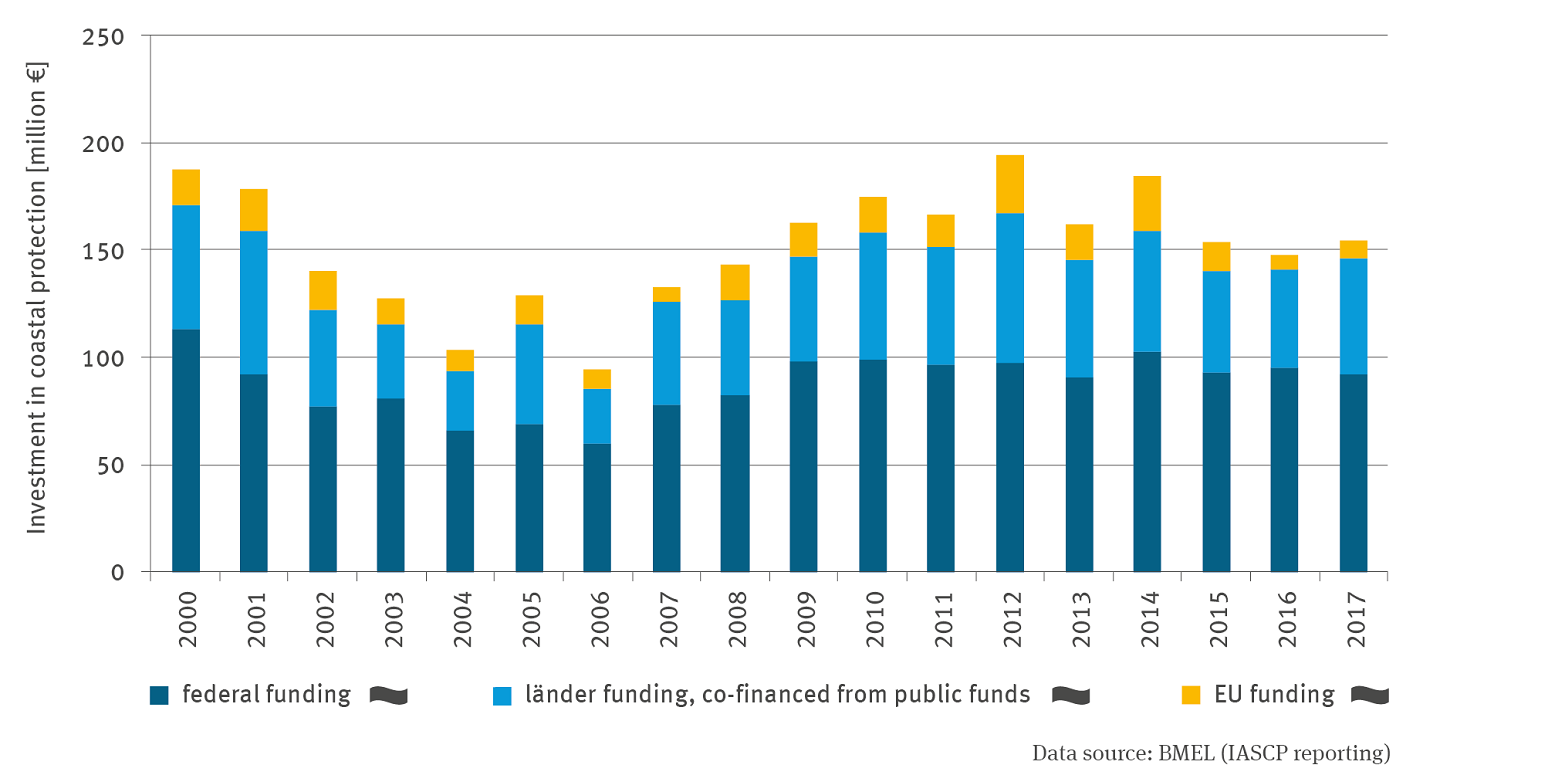
The stacked column graph shows the investments in coastal protection in millions of euros from federal funds, Land funds with additional public funding, and EU funds in the time series from 2000 to 2017. The expenditures fluctuate from year to year; they were highest in 2012 and lowest in 2006. There is no trend in any of the three categories. In all years, the share of federal funds is the highest.
Source: BMEL (IASCP reporting)
Download image (94.48 kB)