Skip to main content Skip to main menu Skip to footer

IG-R-3: Water procurement in the processing industry

The illustration IG-R-3 ‘Water procurement in the processing industry’ contains a line chart which shows the development of water procurement in the processing industry during the period from 1991 to 2019. The illustration is presented as an index for the reference year 2001. There are two lines which show, on one hand the water procurement per price-adjusted gross value added and on the other, the own withdrawal plus the external water supply minus delivery of water to third parties.
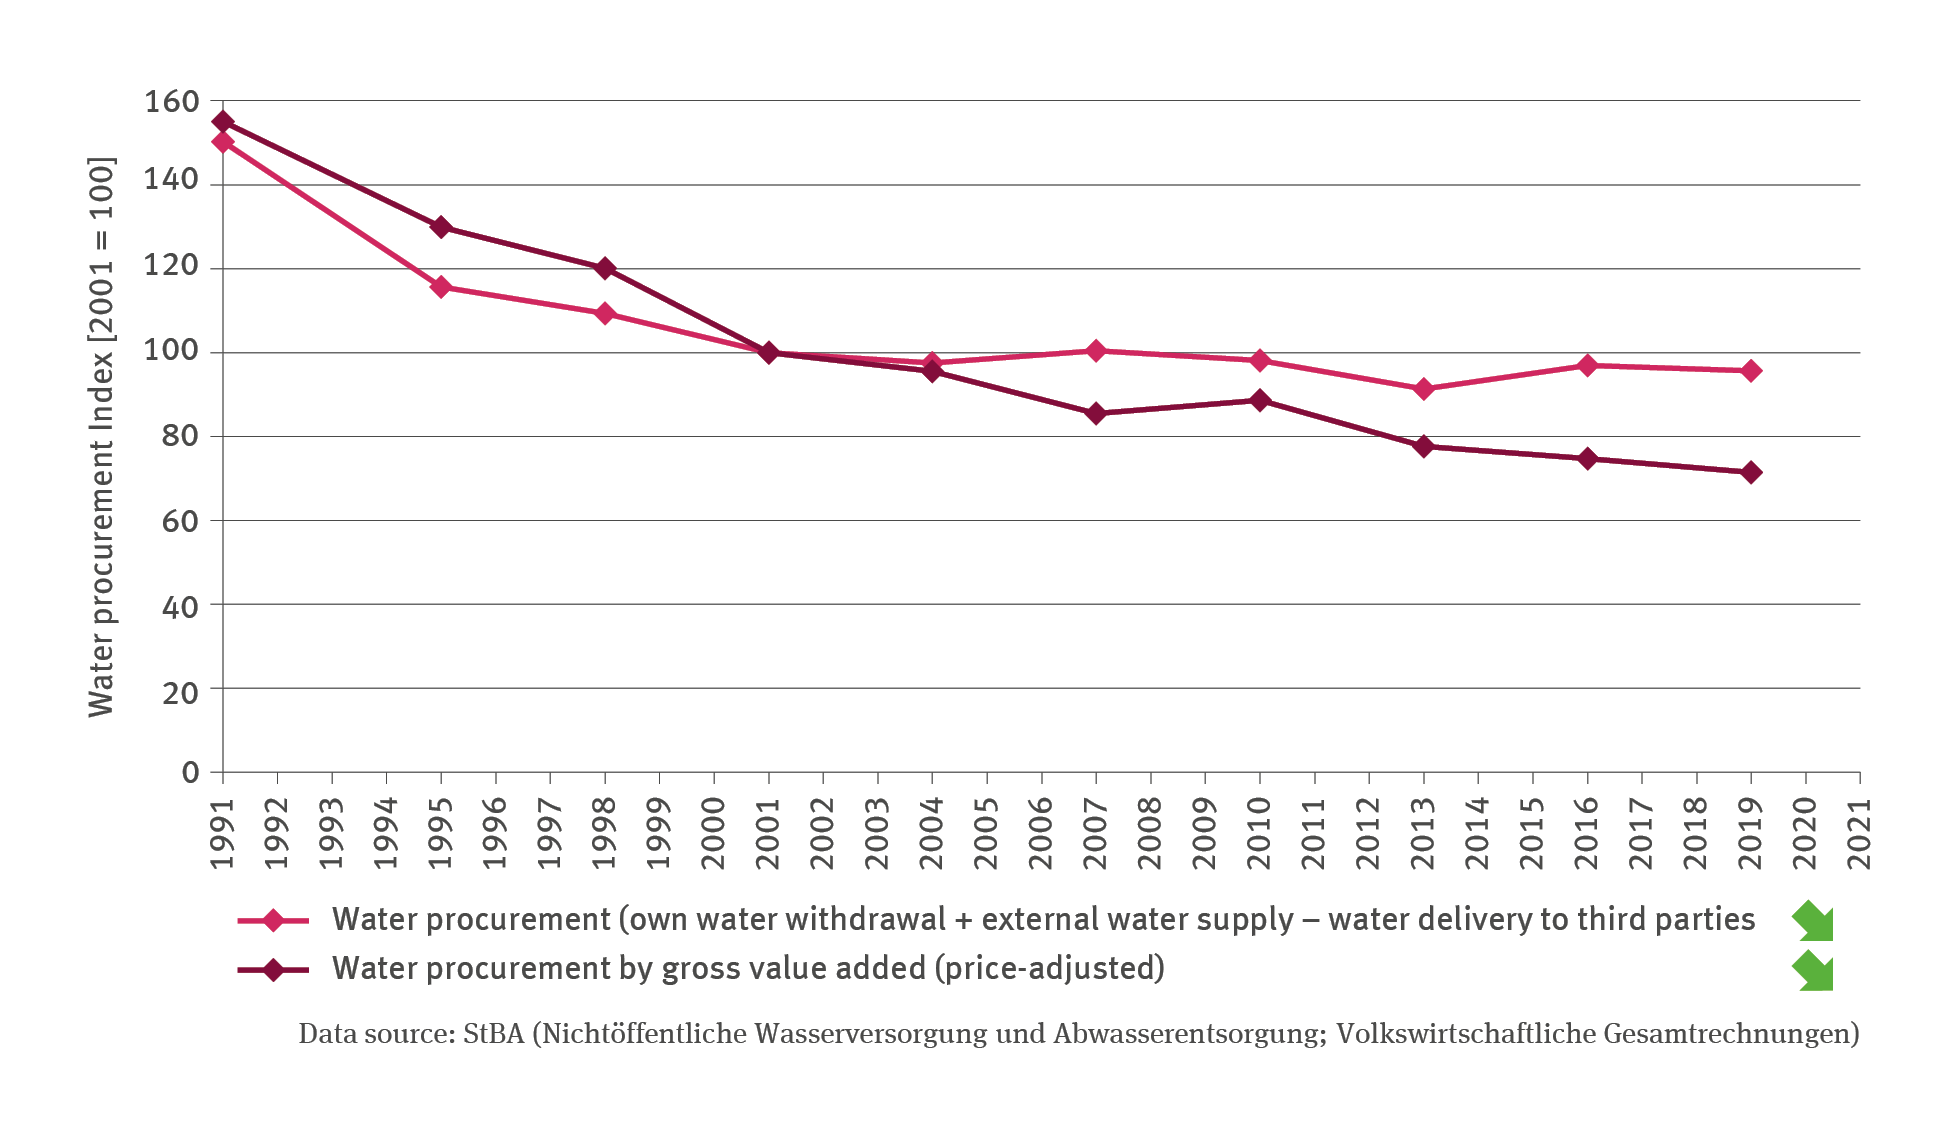
Source: StBA (Nichtöffentliche Wasserversorgung und Abwasserentsorgung; Volkswirtschaftliche Gesamtrechnungen)
Download image (108.20 kB)

The following contents contain this medium:

Short link: www.uba.de/m111867en