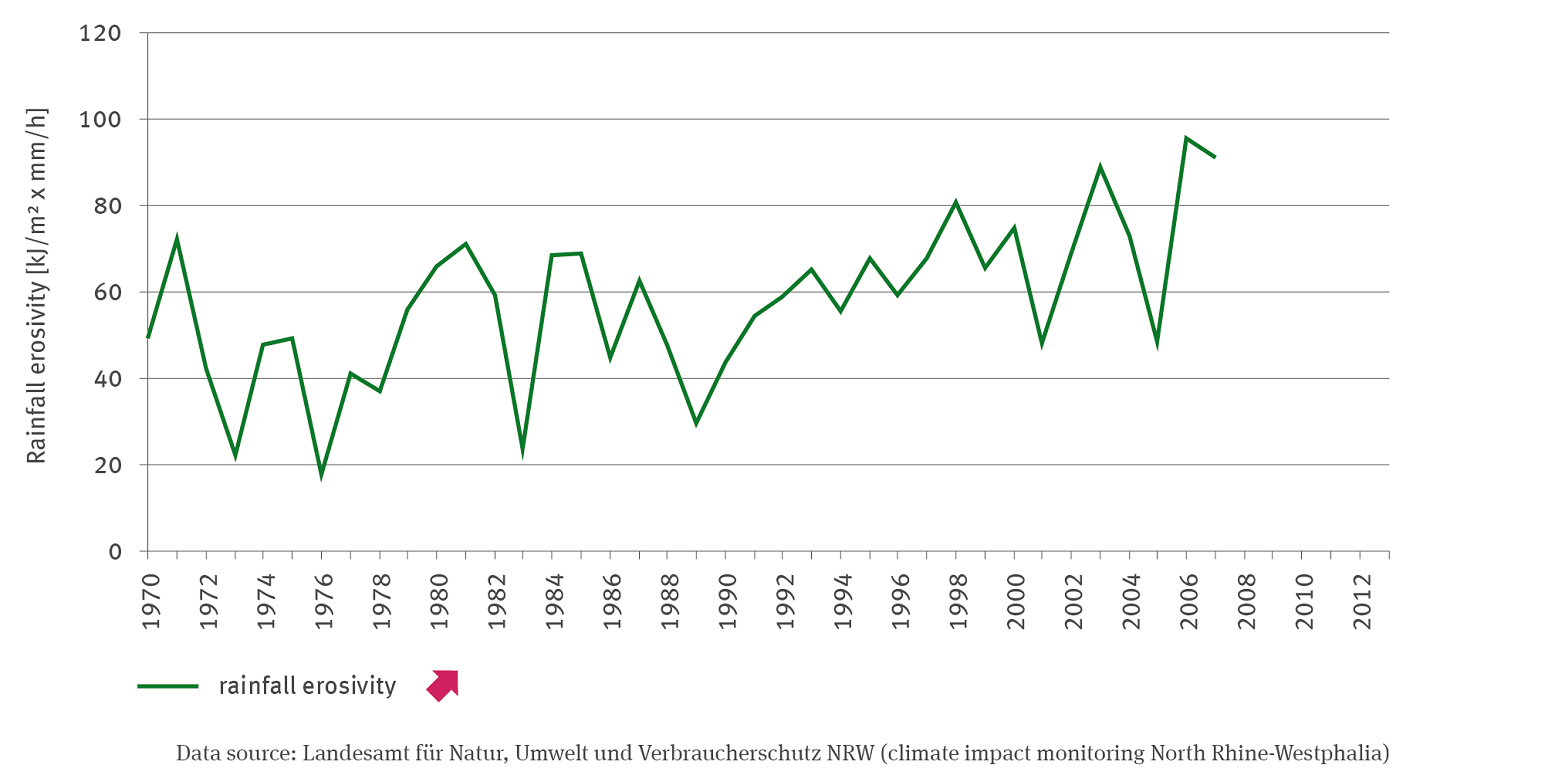
The line graph shows the rainfall intensity in kilojoules per square metre times millimetres per hour. The period from 1970 to 2007 is shown. The values fluctuate strongly between the years and range from less than 20 in 1976 to more than 90 in 2006. The time series has a significantly increasing trend.
Source: Landesamt für Natur Umwelt und Verbraucherschutz NRW (climate impact monitoring North Rhine-Westphalia)
Download image (132.66 kB)