Skip to main content Skip to main menu Skip to footer

LW-R-3: Adaptation of the variety spectrum in viticulture

The illustration contains a biaxial chart. The chart shows the percentual deviation of the Huglin Index for the period 1970 to 2021 from the multi-annual mean for the period 1961 to 1990.
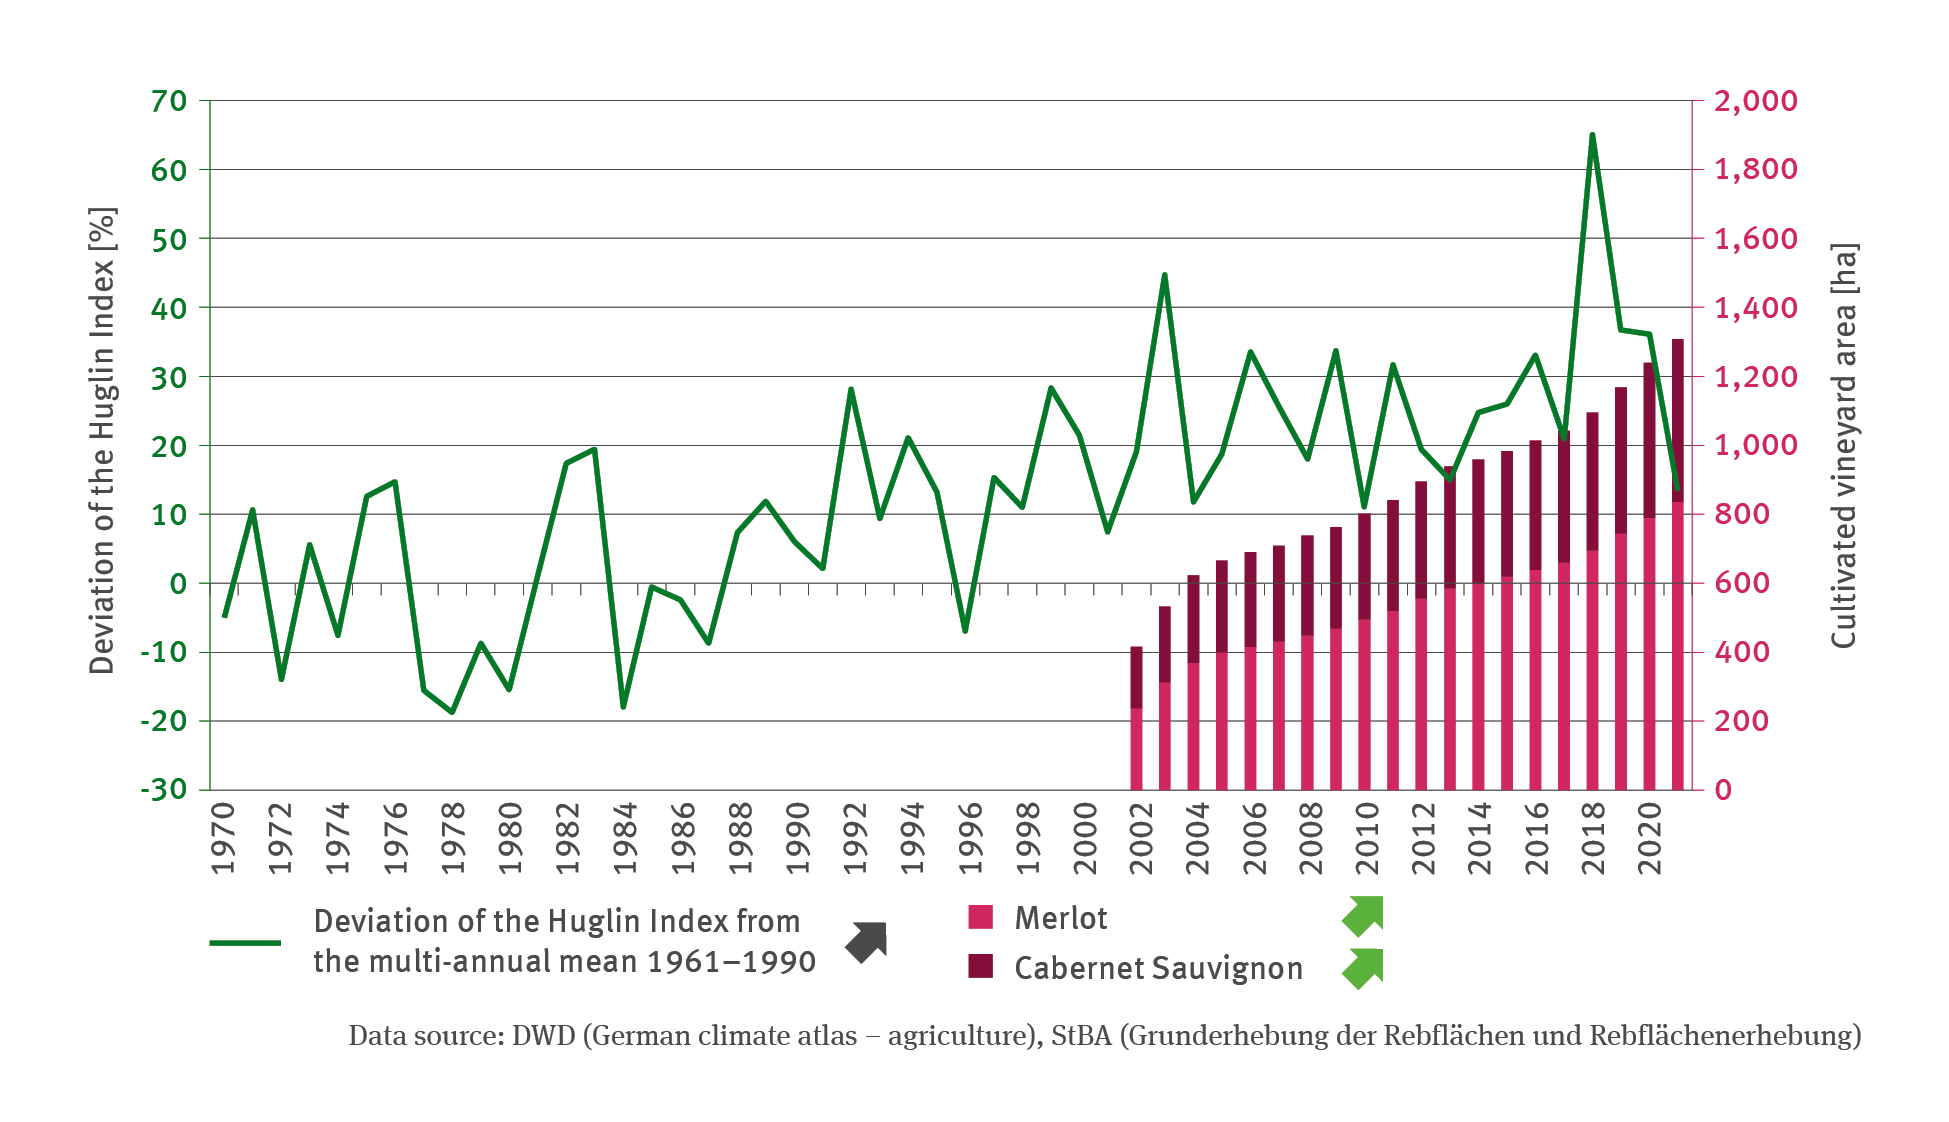
Source: DWD (German climate atlas – agriculture); StBA (Basic survey of vineyards and vineyard area assessment.)
Download image (156.22 kB)

The following contents contain this medium:

Short link: www.uba.de/m111576en