The development of Germany’s climate since the end of the 19th century
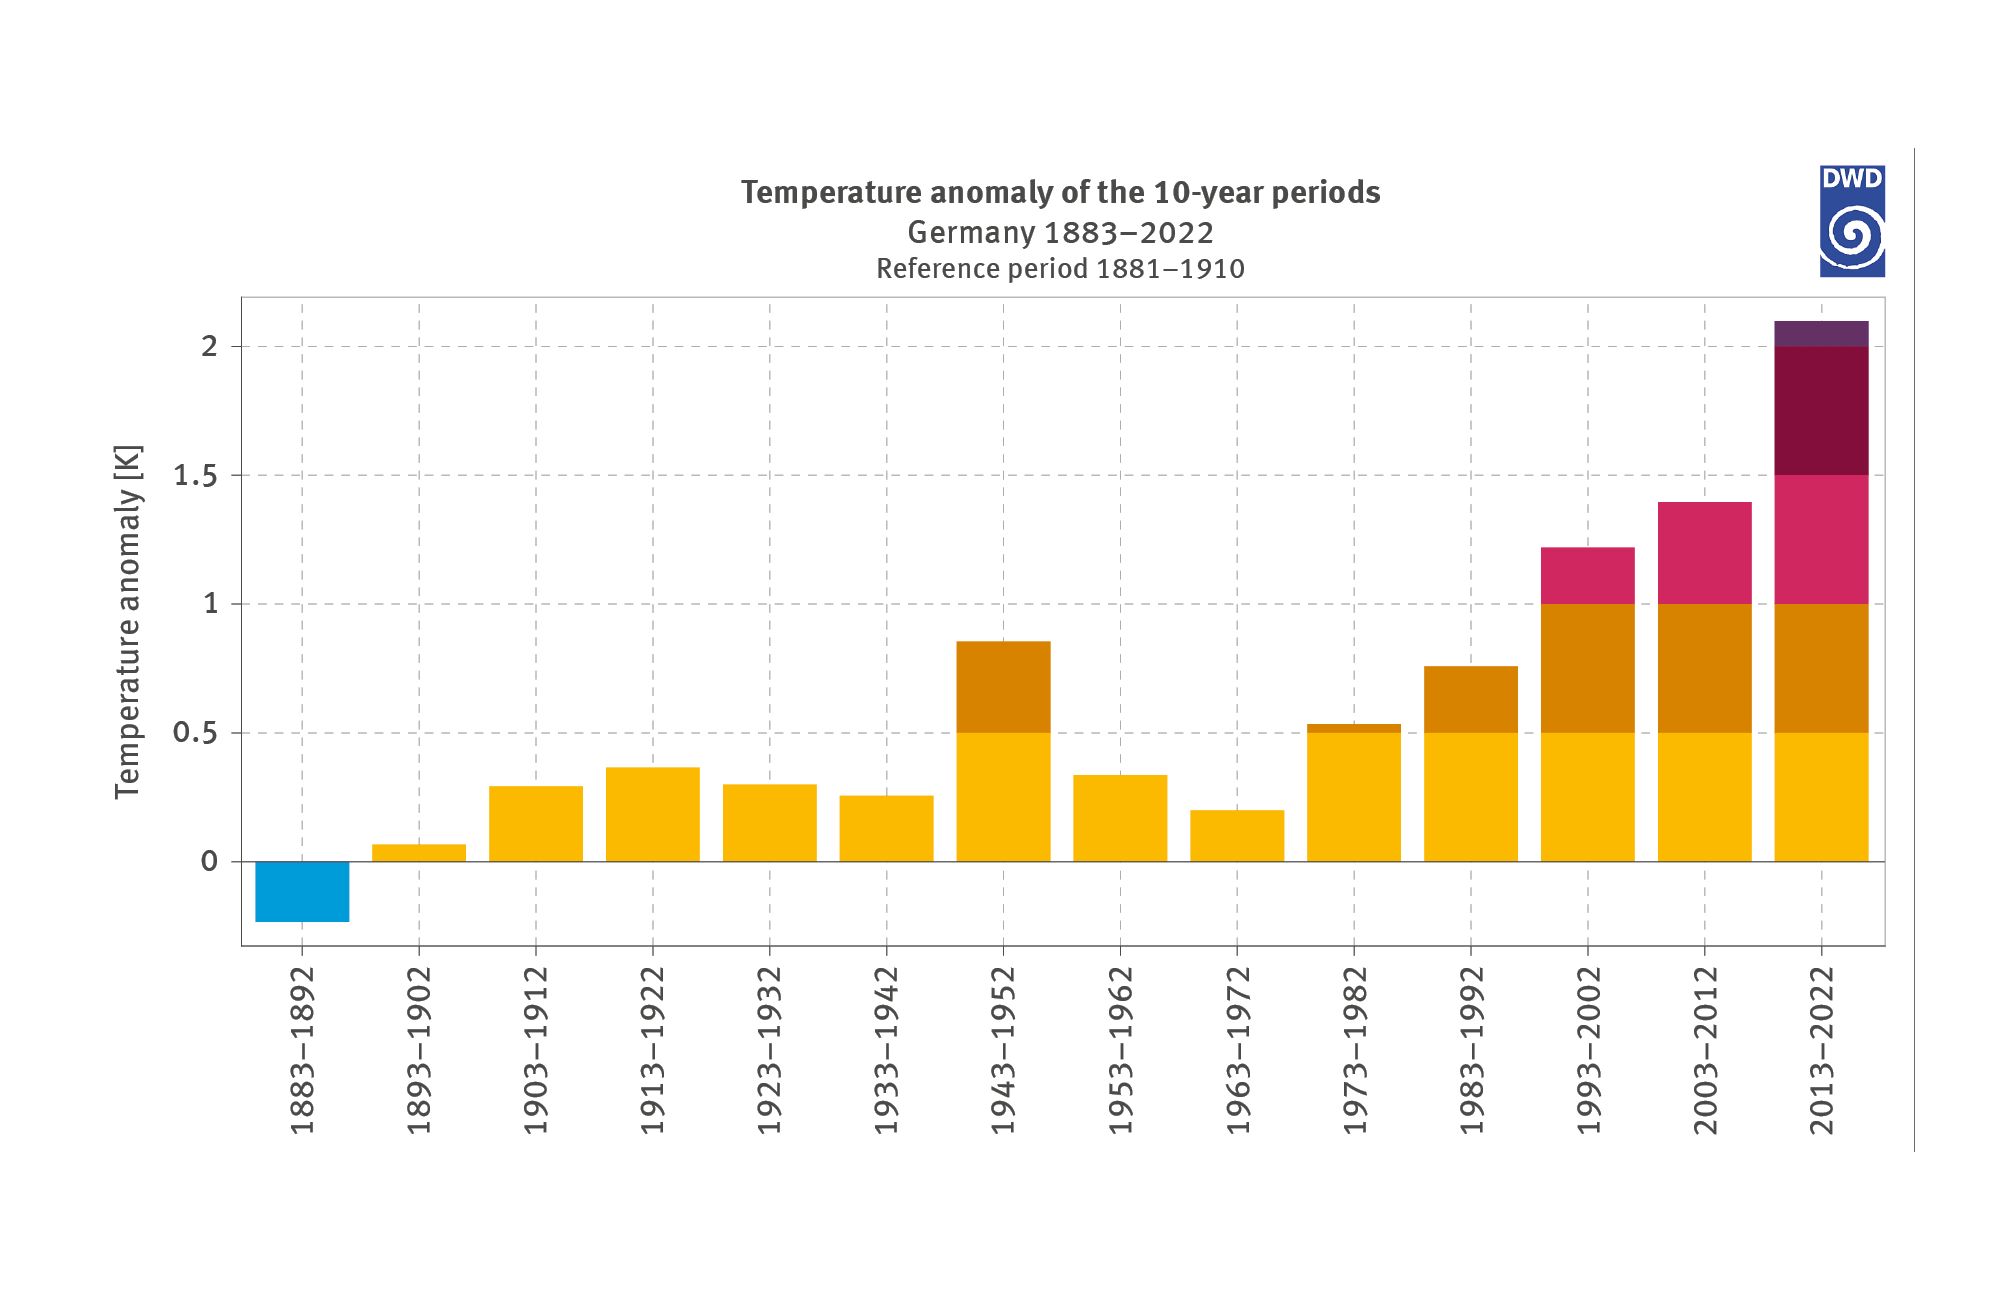
The climate can be described as the mean condition of the atmosphere, characteristic extreme values and in terms of the frequency distribution of meteorological phenomena such as air temperature, precipitation and wind in a specific location. The climate is the outcome of complex interactions among all components that make up the system of land, atmosphere and oceans. Also part of this system are the biosphere with seasonal changes in vegetation, the hydrosphere, the soil and the cryosphere (ice). The climate can vary in different timescales even without the influence of human activity. This is well-known, for instance, from evidence of glacial periods which repeatedly enveloped major parts of Germany in an icy carapace. However, the assessment of observational data since the mid-19th century indicates progressive global warming which cannot be attributed to natural causes, and nowadays it is considered an established scientific fact that further temperature increases are to be expected. Both in Germany and globally, the mean value of average temperatures on the surface of land and water has steadily increased in the course of recent years. It can be stated that since the 1960s, every decade was warmer than the decade before6.
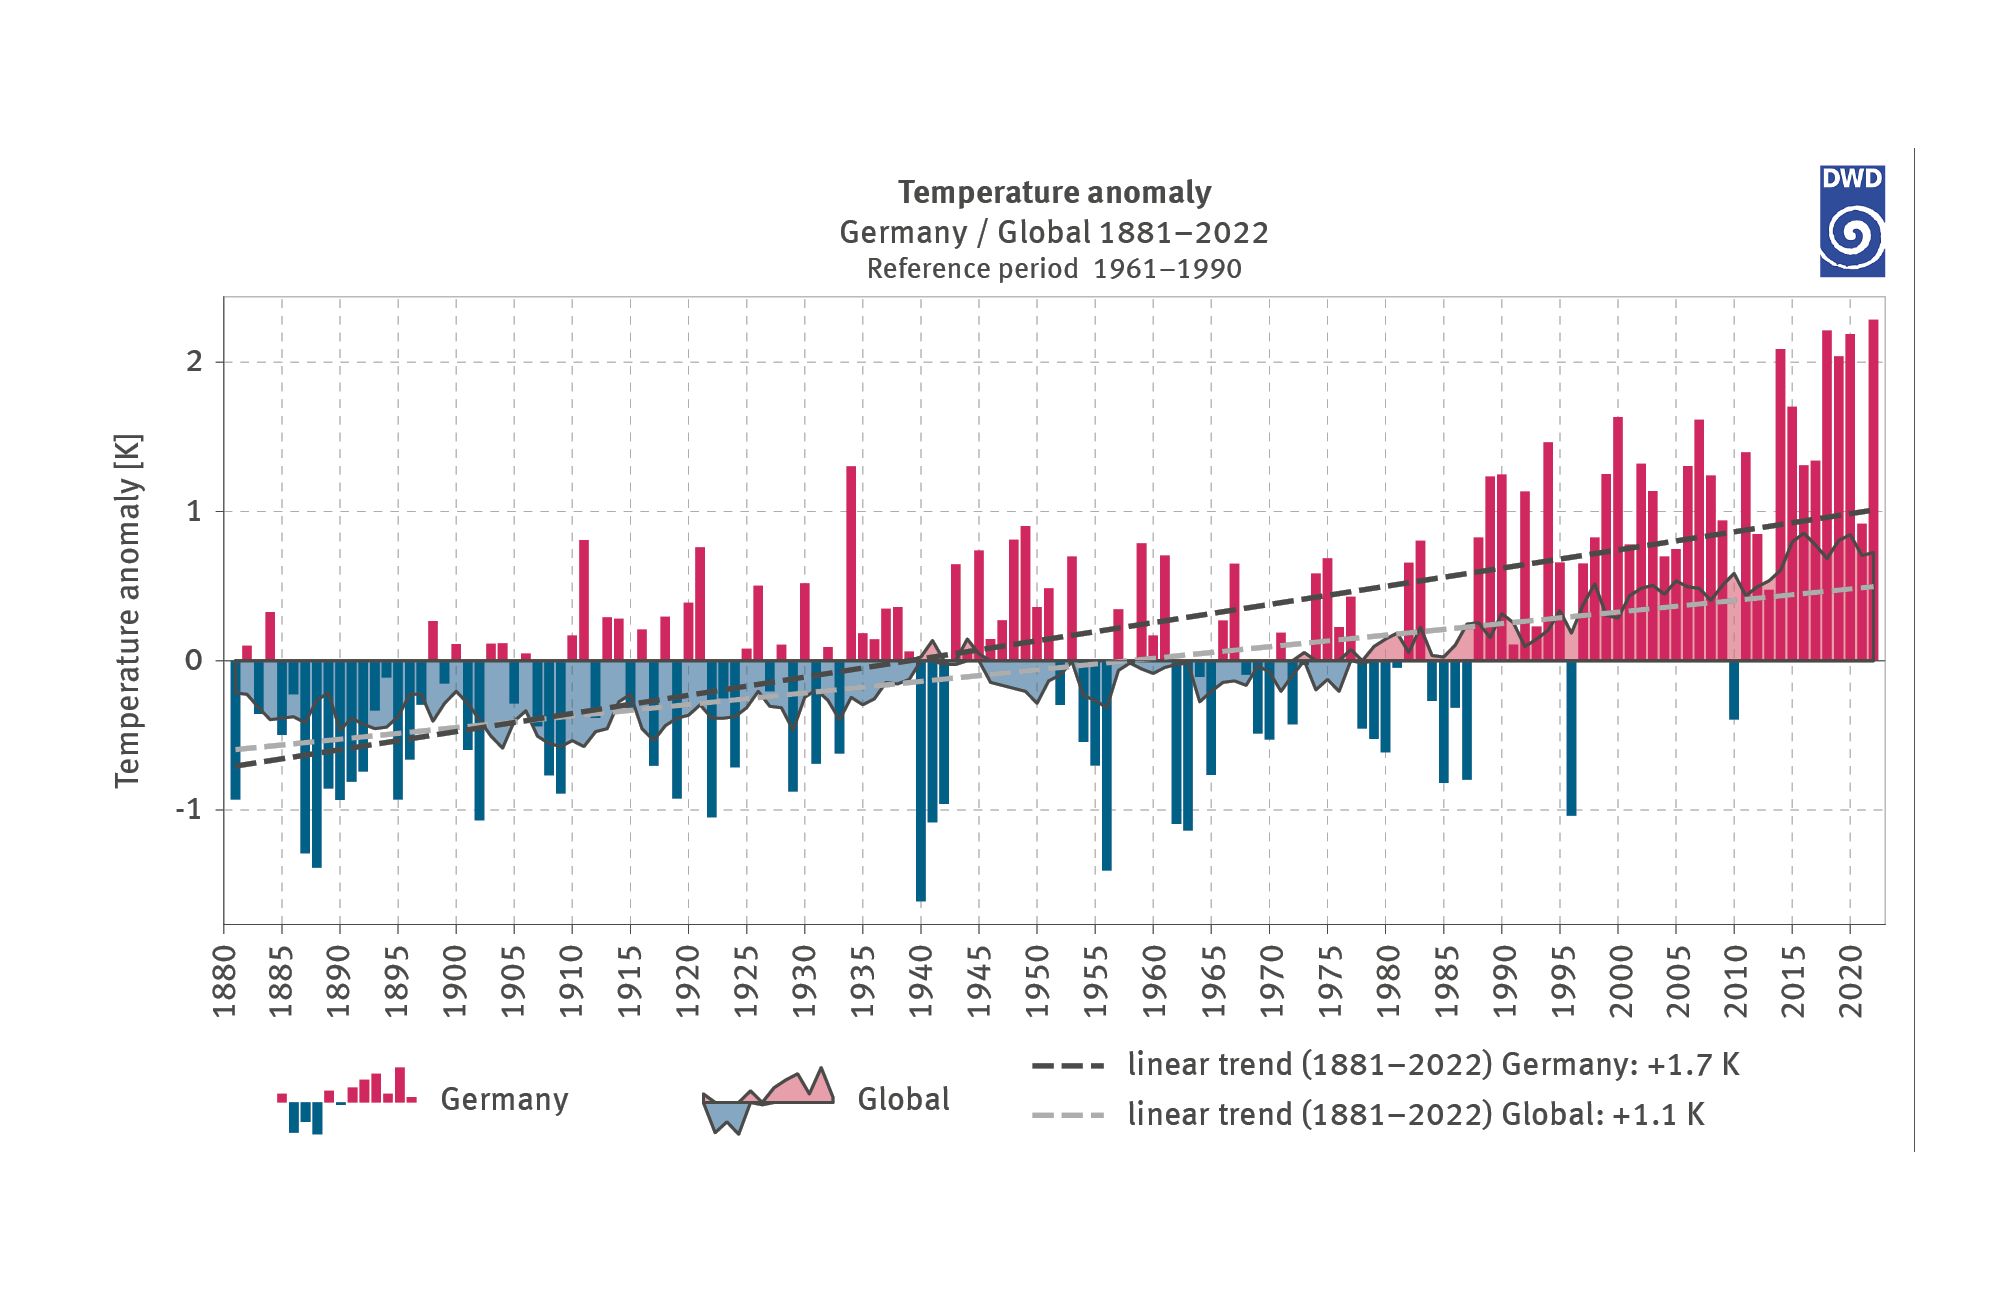
According to the analyses carried out by the American federal research organisations NASA and NOAA, the global average temperature is currently around 1.1 °C above the level prevailing at the end of the 19th century7 7. It should be noted that most of the warming occurred in the course of the past 50 years: 21 of the 22 warmest years in global records were recorded in the years since 2001, with 2016 being regarded globally as the warmest year so far, and the years from 2014 to 2022 were, in global terms, the nine warmest years since systematic records began.
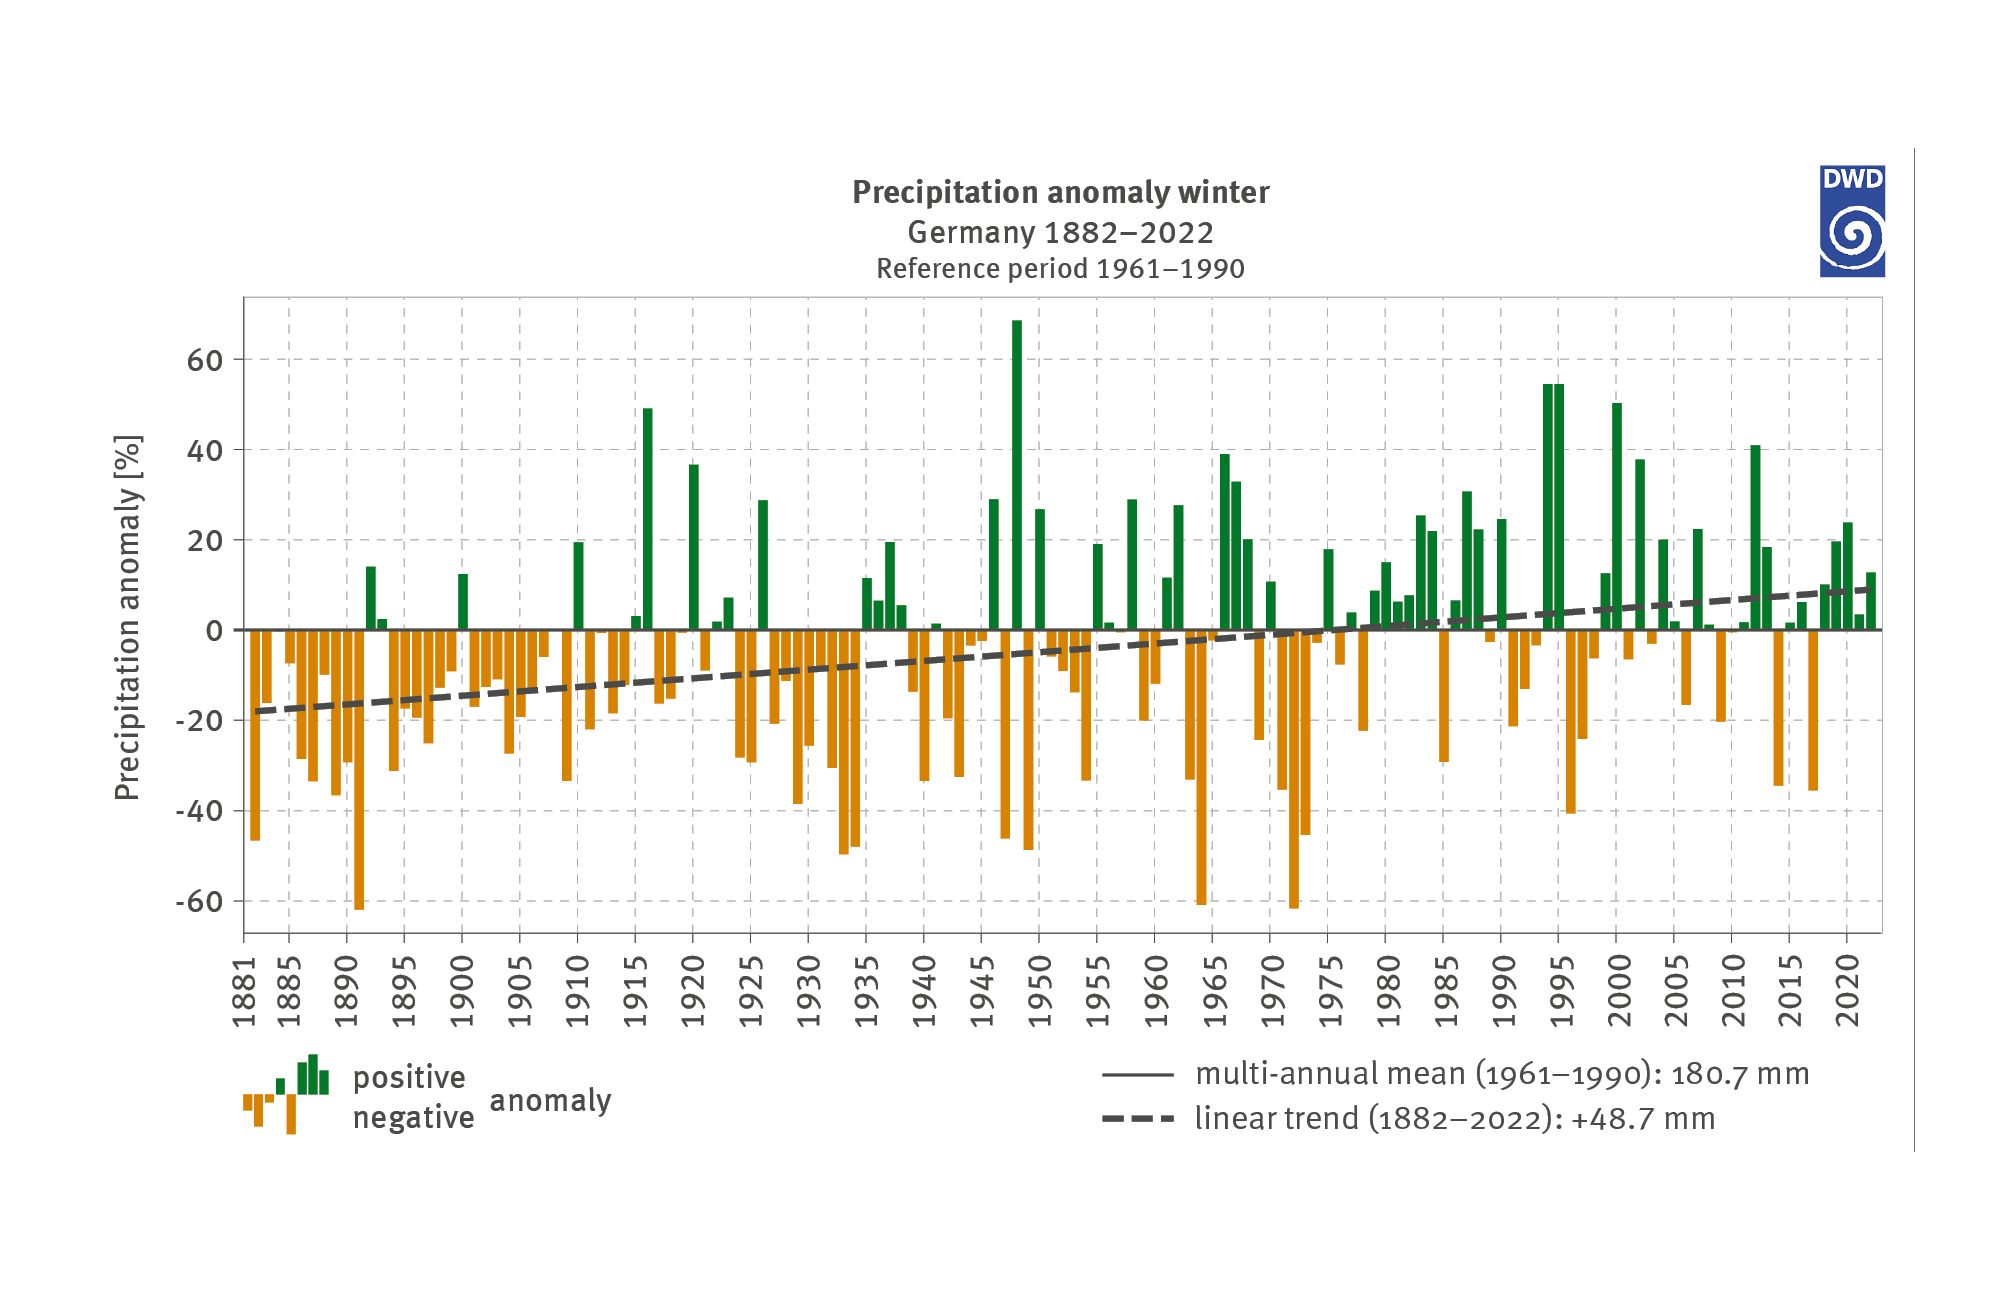
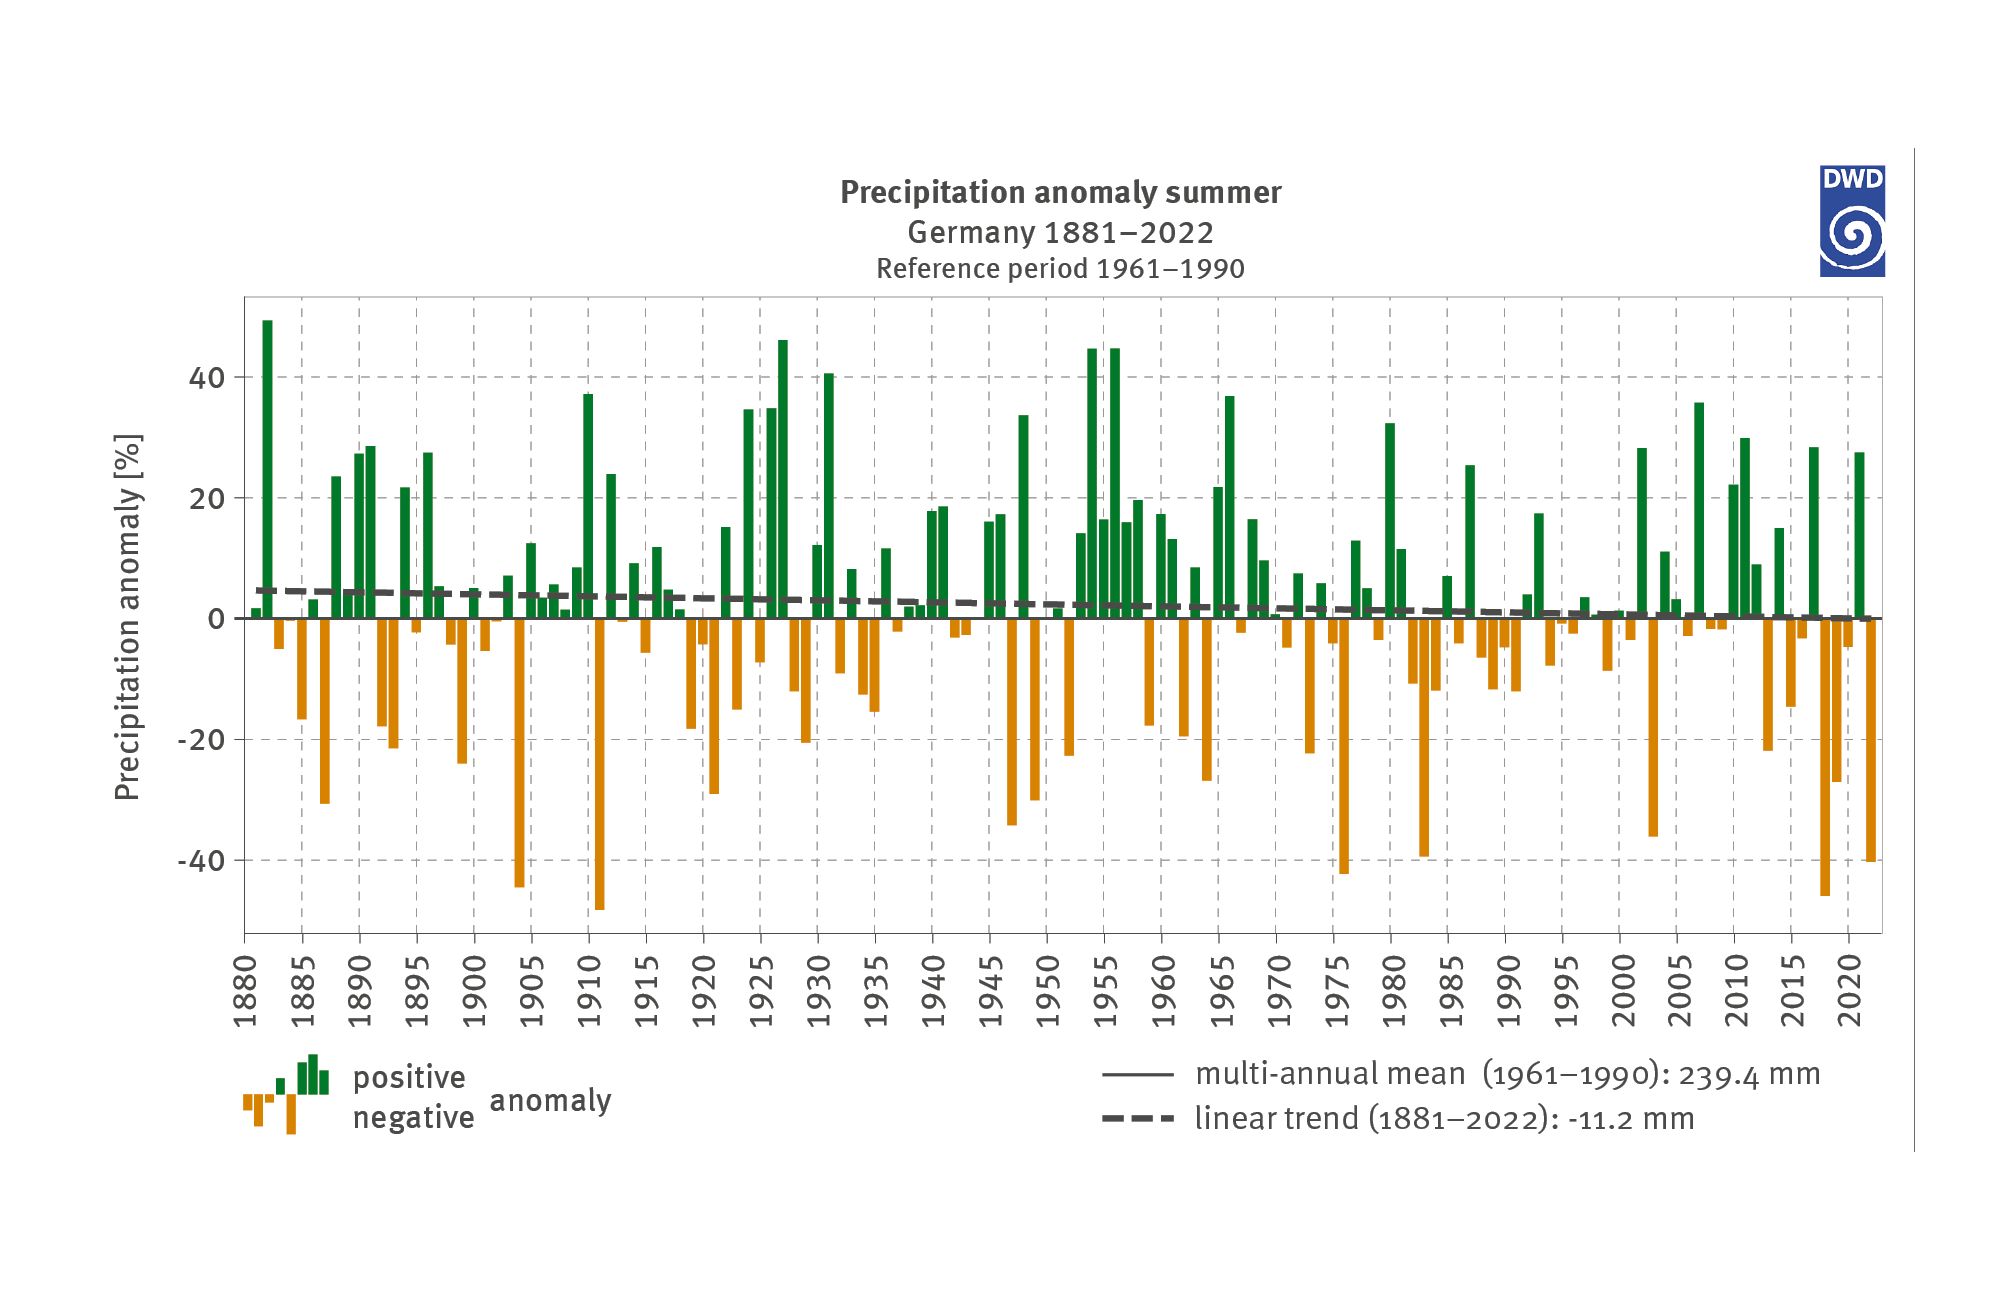
For Germany, sufficient data exist from 1881 onwards making it possible to identify climatic changes nationwide. However, this can be said only for the monthly observation of variables such as temperature and precipitation. Relevant, mostly contiguous daily data as well as other measured variables such as sunshine duration are generally not available for the years prior to 1951. While the impact of additional greenhouse gases on the increase of temperature since 1881 is patently obvious, whereas the correlation with changes in the precipitation scenario is more indirect and hence less obvious. This is partly due to changes triggered by general warming in large-scale atmospheric weather patterns. Precipitation is a crucial factor in the availability of water and is virtually of the same major interest as temperature itself.
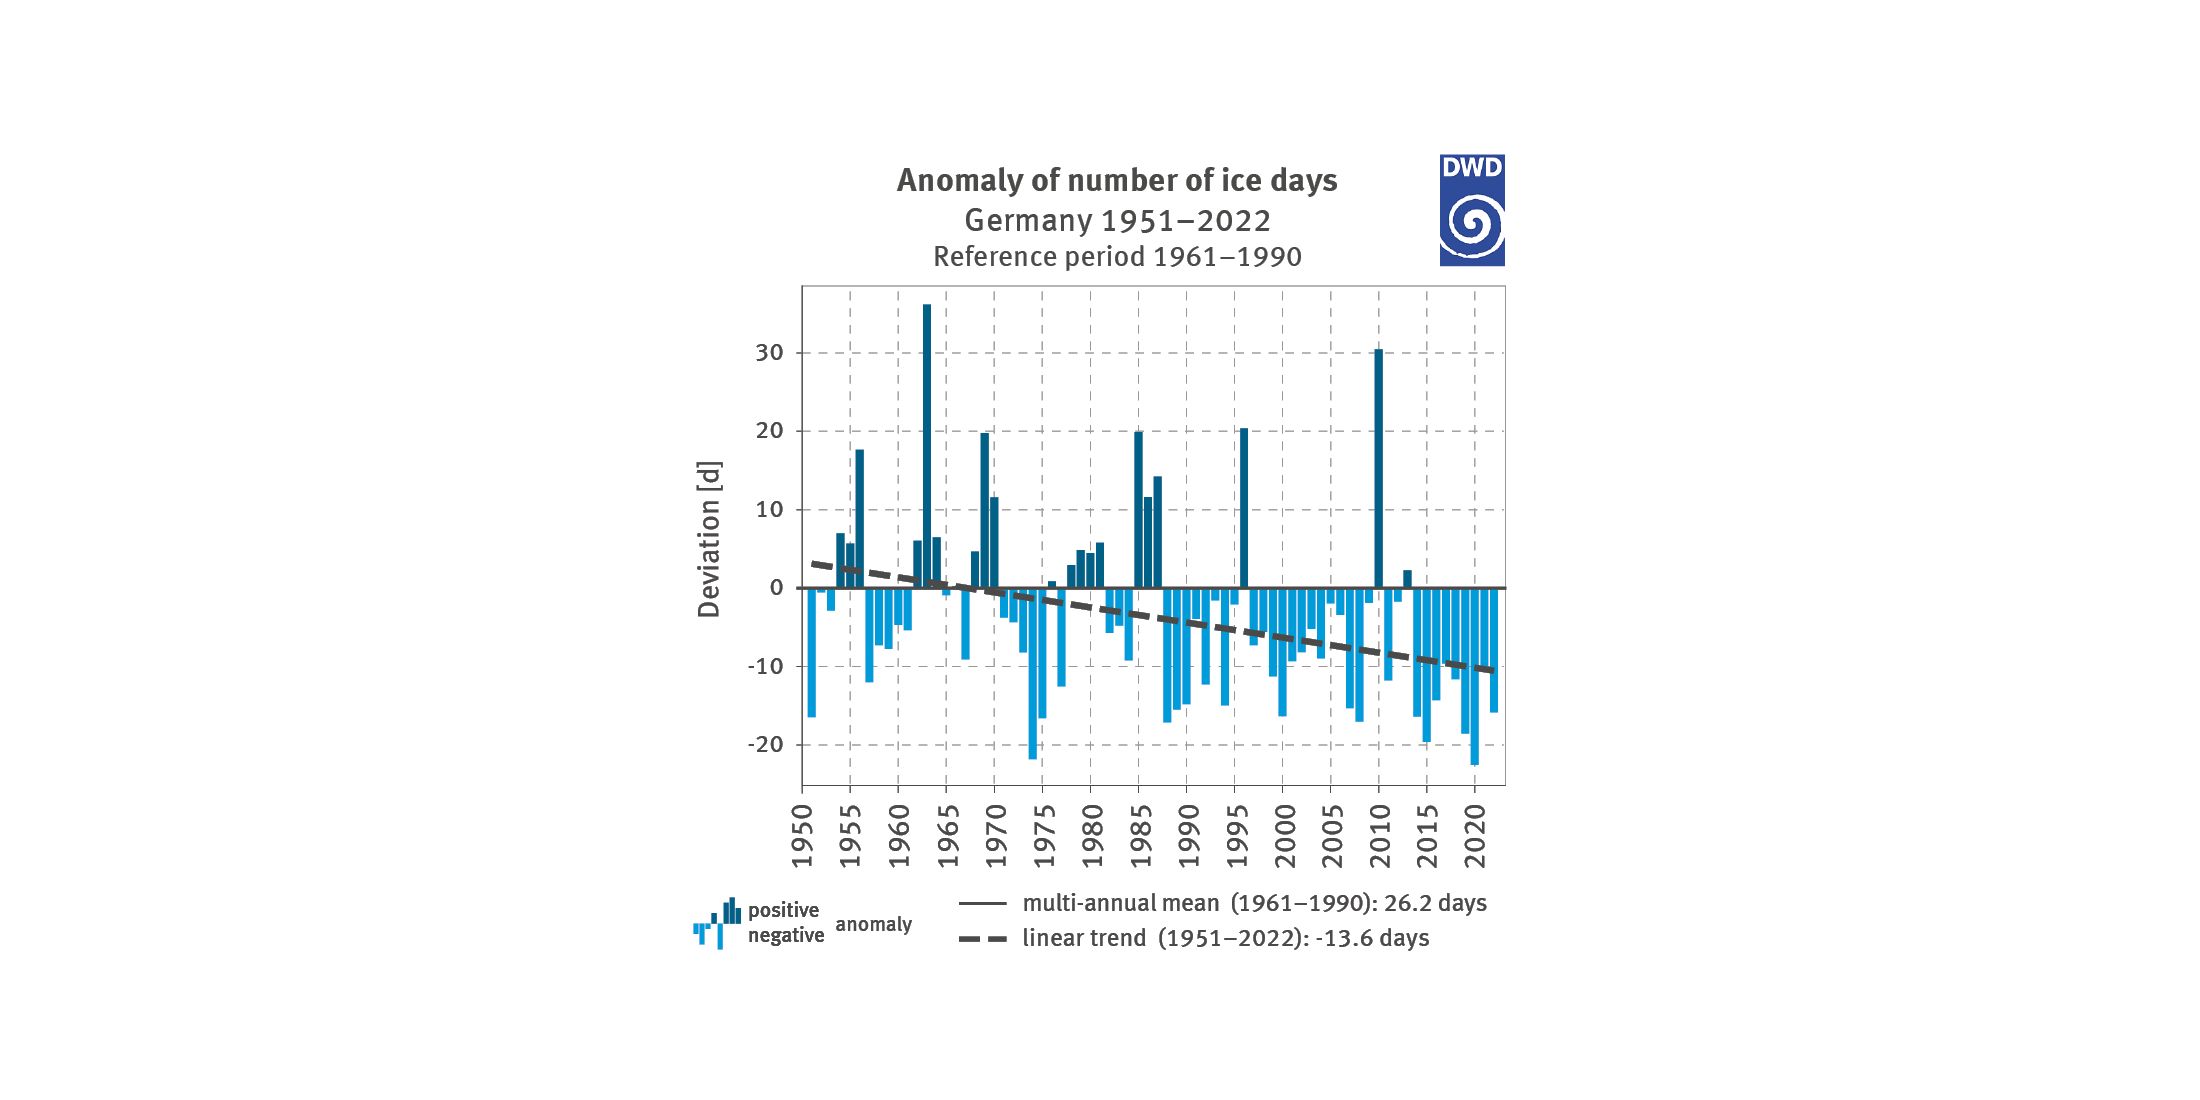
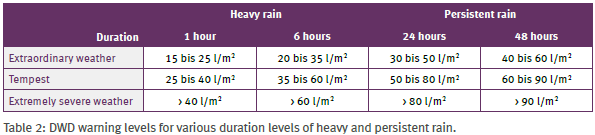
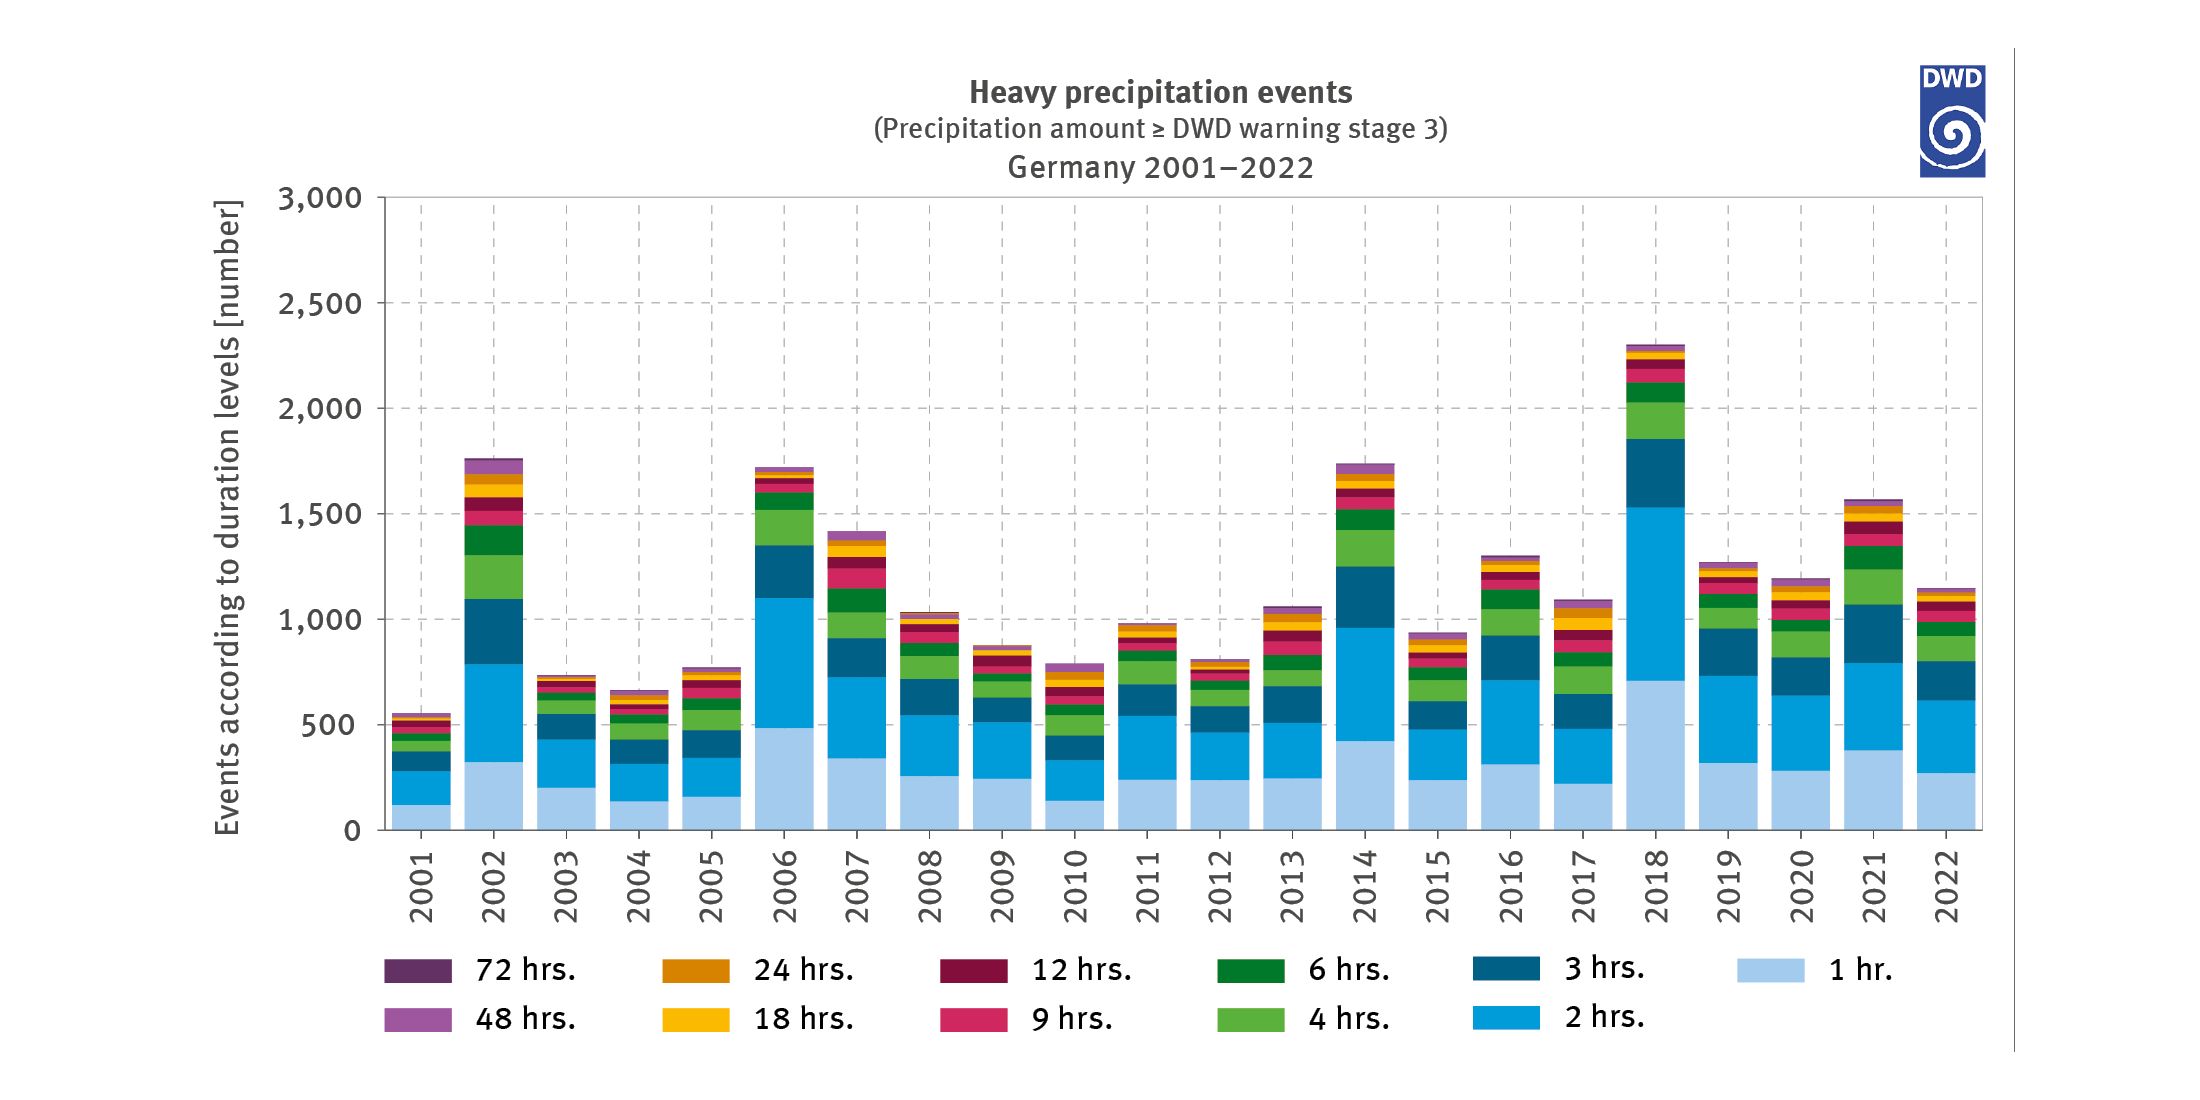
One consequence of global warming can be seen in major changes to extreme weather events. This includes, for instance, regional shifts resulting in extreme weather events occurring in areas where they had not occurred previously. Likewise, there is an increase – within some regions such as Germany – of extreme weather events including heatwaves, and a decrease in other extreme weather events such as severe frost. The change in extreme thermal events owing to climate change is quite distinct and also scientifically proven, leading to grave consequences for many sectors of society. As far as heavy-rain events and extended drought phases are concerned, statements tend to be more differentiated and less clear-cut.
The subsequent paragraphs are intended to: first provide an overview of the development regarding the mean values of climatic conditions which have prevailed in Germany since 1881, followed by an assessment of changes regarding extreme events and then a look at what our future climate will potentially be like.