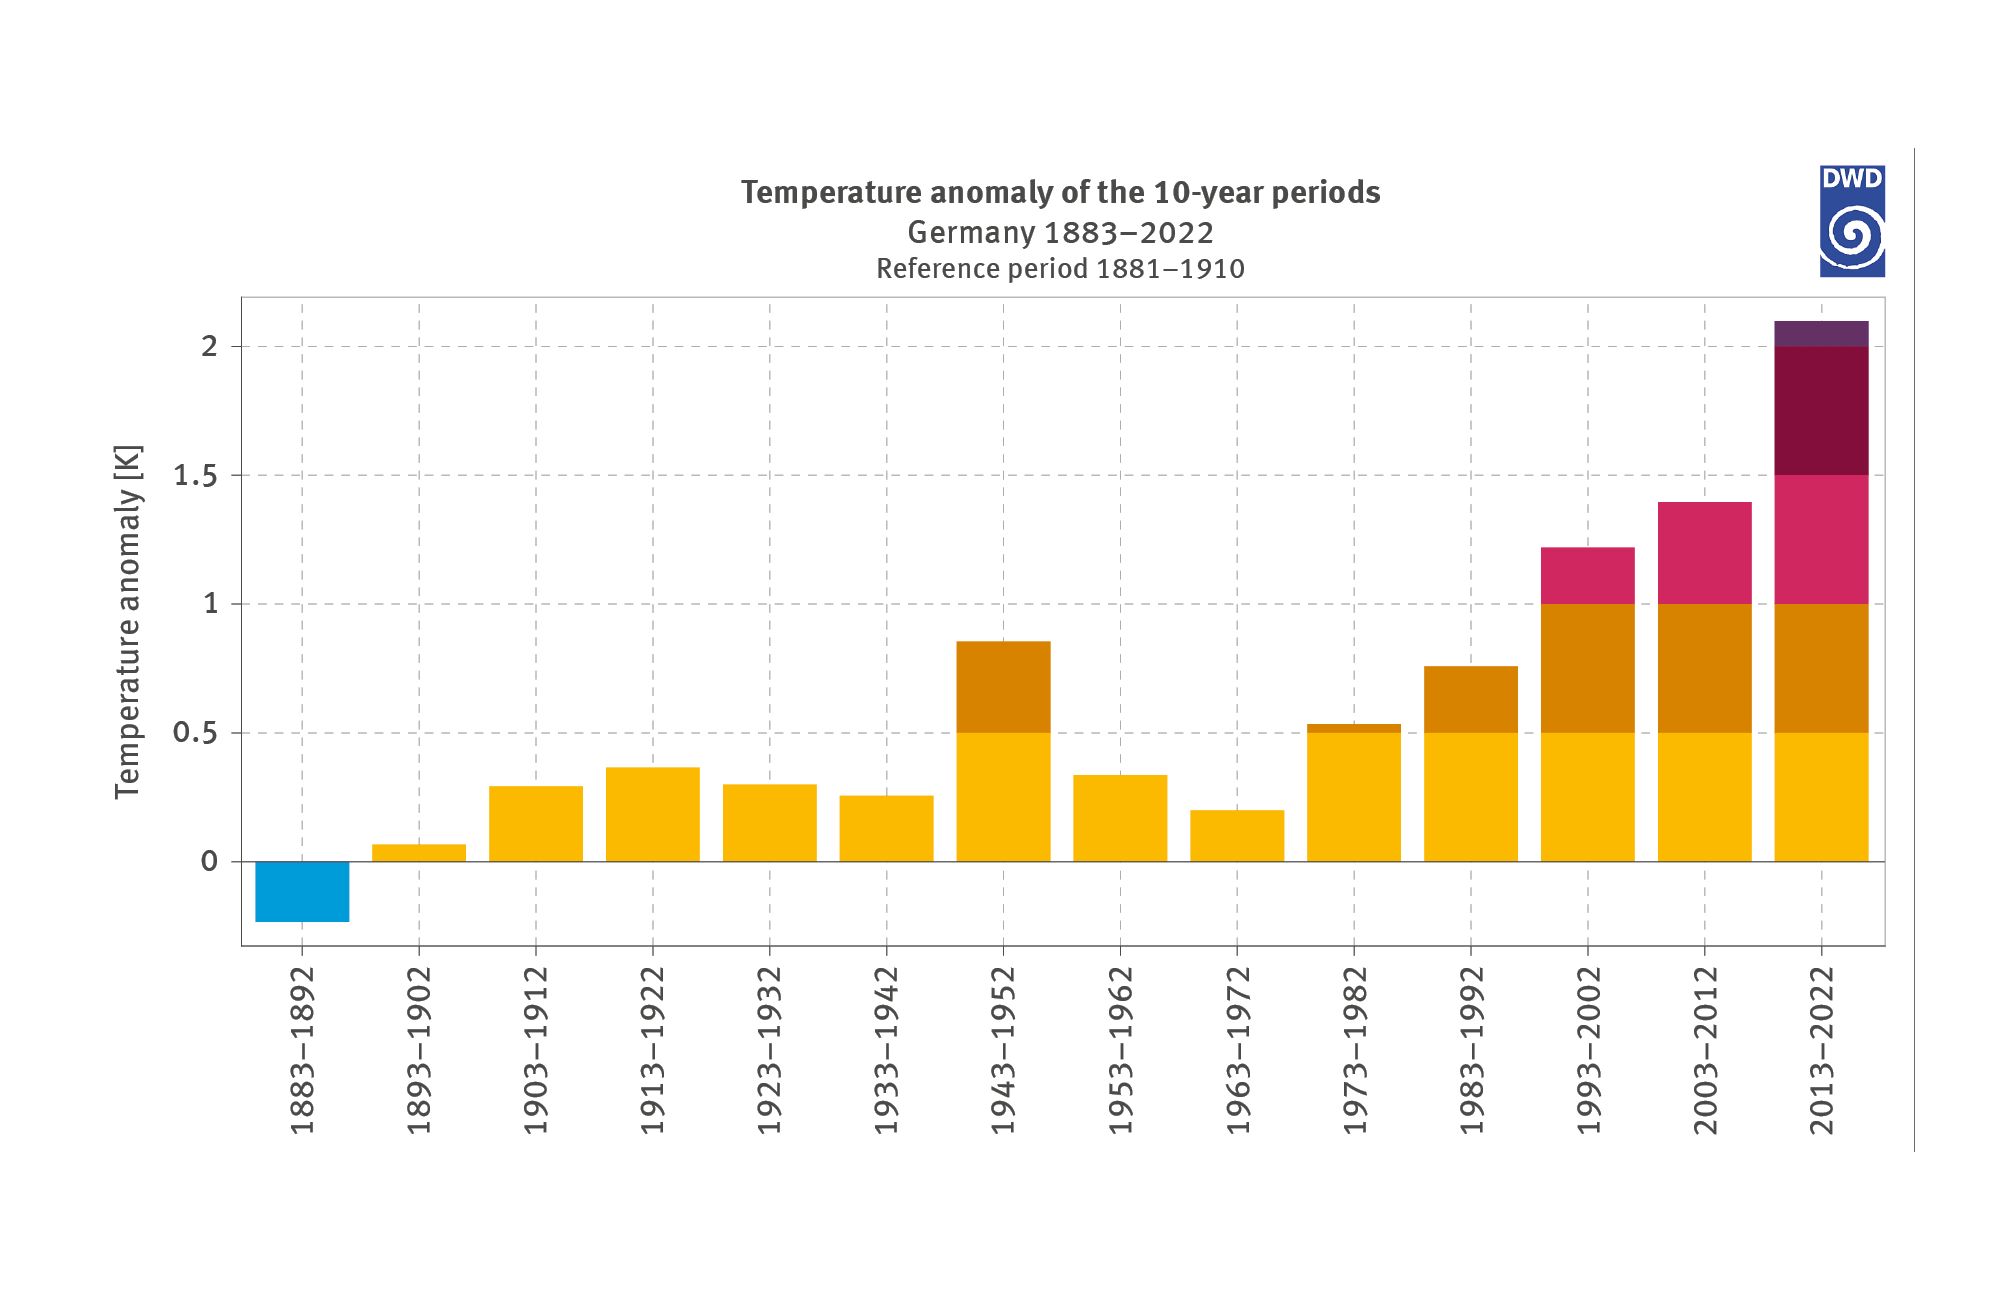
The chart shows the deviations of the mean temperature of the 10-year periods from the multi-annual mean for the period from 1961 to 1990. The past 10-year periods are illustrated starting with 1881. The negative deviations are illustrated in blue below the zero line, while the positive deviations are in red above the zero line. It is clear to see that a negative deviation exists only for the 10-year period from 1881 to 1890. In the subsequent 10-year periods up until 1980, there were positive deviations amounting to a maximum of 0.8 kelvin. For the past three 10-year periods observations show that there were higher positive deviations of more than 1 kelvin. For the period of 2011 to 2020 the deviation of the 10-year mean temperature from the multi-annual mean reached 2 kelvin.