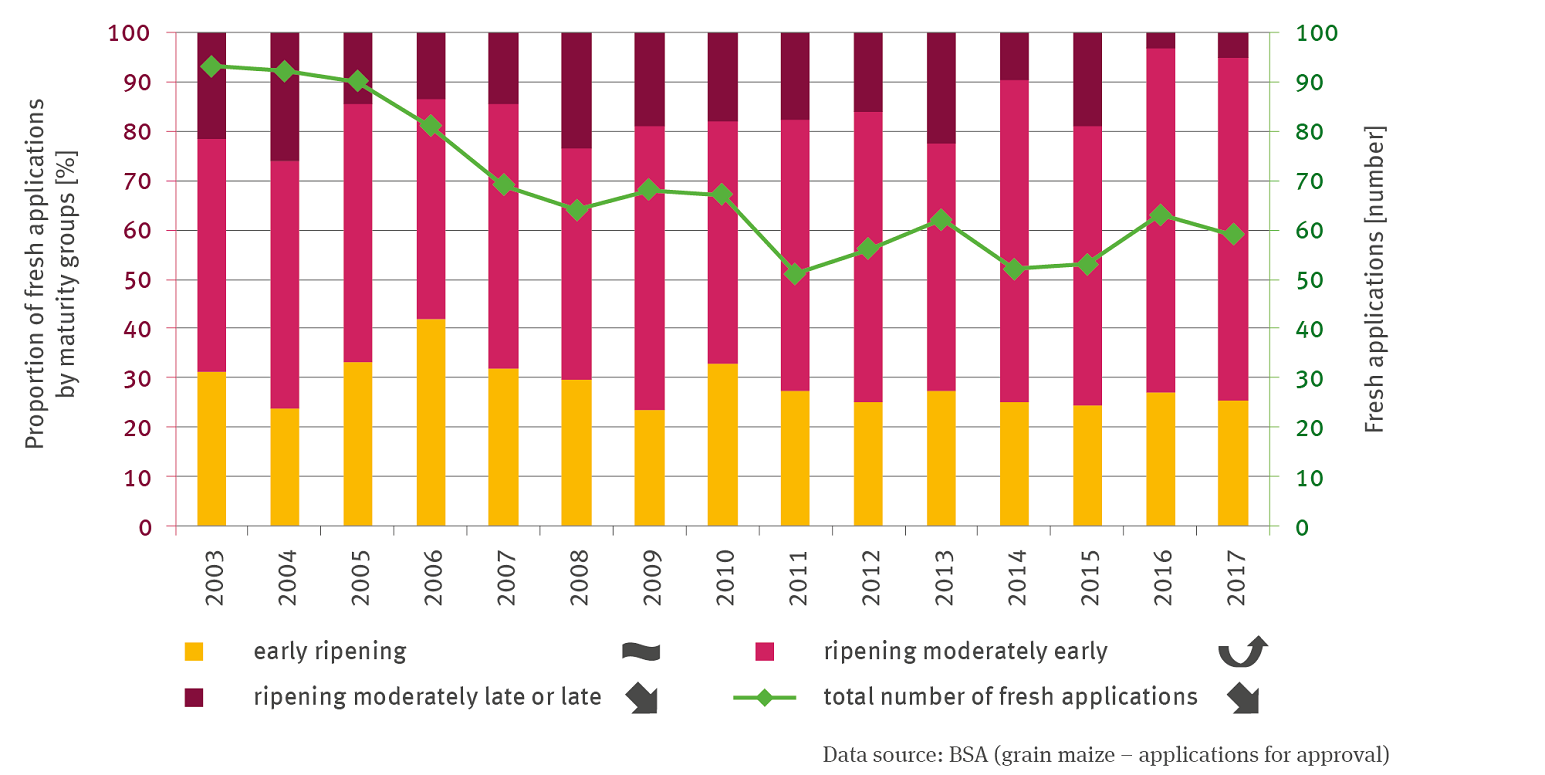
The stack column graph shows the share of new applications of maize varieties in percent in the maturity groups early-maturing, medium-early-maturing and medium-late-maturing from 2003 to 2017. There is no trend for the early-maturing varieties, but a quadratically increasing trend for the medium-early-maturing varieties. These varieties have also recently had by far the highest share of new applications. New applications for medium-late-maturing varieties have decreased significantly. A line graph also shows the total number of new applications. There is a significant downward trend here.
Source: BSA (grain maize - applications for approval)
Download image (161.14 kB)