Indicator: Air quality in agglomerations

Source: German Environment Agency Figure as PDF
- The background level of one main air pollutant (ozone) in German agglomerations still exceeds World Health Organisation (WHO) guide line values.
- Close to sources, pollutant levels can even be significantly higher.
- The situation regarding nitrogen dioxide and particulate matter has greatly improved since 2000. In 2020, the mean value fell below the WHO recommendation for PM 2.5 for the first time.
- Ozone and particulate matter pollution are very dependent on the weather. Levels thus fluctuate significantly.
Nitrogen dioxide (NO2), particulate matter (PM2.5) and ozone (O3) are of particular concern to human health. Many premature deaths are also attributed to particulates, as well as damages to ecosystems.
The World Health Organisation WHO has defined air quality guideline values for particulates and ozone (WHO 2006). A new recommendation for NO2 has been proposed in a research paper (WHO 2013). Above these levels, health risks increase significantly. These values are stricter than the limits defined in the EU Air Quality Directive.
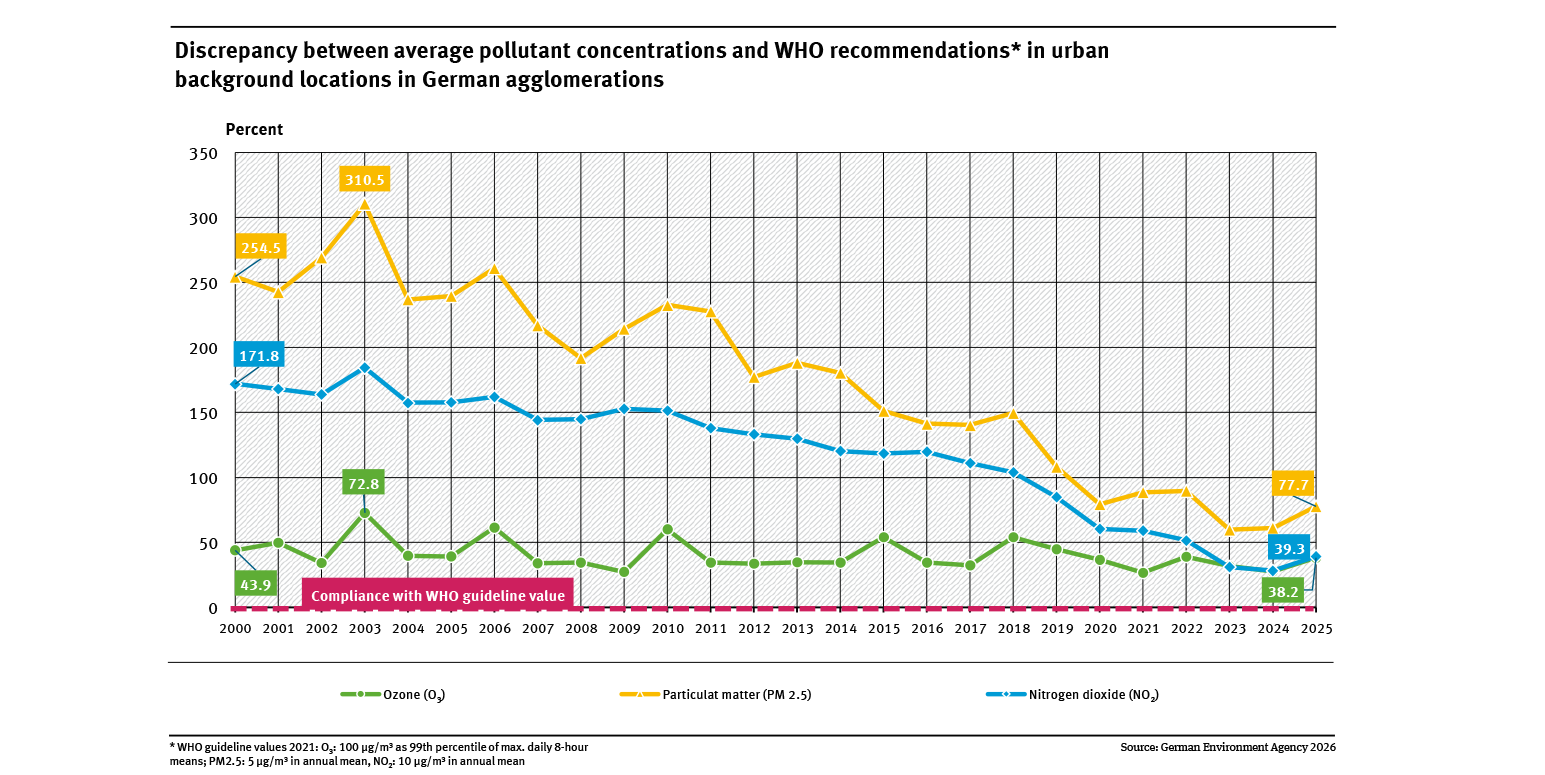
Air quality is particularly precarious in agglomerations, where one third of the German population lives. Here, industry, traffic and residential areas exist in close proximity. The indicator incorporates data from monitoring stations which measure background urban pollution levels. At busy locations in cities pollution levels may be significantly higher. The indicator represents the average discrepancy of all monitoring stations of urban background from WHO guideline values, respectively. Even with negative indicator values, individual monitoring stations can still be above the target value.
Levels of nitrogen dioxide and particulate matter have fallen considerably. 2019 is the first year in which nitrogen dioxide falls below the WHO recommendation in agglomerations. In 2020, the mean level of PM2.5 was also just below the WHO recommendation for the first time. However, ozone concentrations fluctuate widely. This is largely due to the influence of the weather. In hot summers such as 2003 or 2015, ozone concentrations rise sharply. Thus it is impossible to make a meaningful statement about the trend in recent years.
In 2008 the EU set out its air quality objectives in the Air Quality Directive (EU Directive – 2008/50/EC). The German Environment Agency believes that, in the long term, the limit values defined in the directive should be reduced to the WHO recommendations. Even then, large parts of Germany would still fail to meet the less ambitious targets of the EU directive (UBA 2022). There is still a long way to go until the air in agglomerations is sufficiently ‘clean’.
The indicator is based on measurement data from the network of German air quality monitoring stations. All monitoring sites within an agglomeration were included in the measurement of urban and suburban background pollution levels. Measurements of these monitoring sites are used to calculate the extent to which the three pollutants NO2, PM2.5 and O3 exceed or fall short of WHO recommendations. The average discrepancy between the values recorded at all monitoring stations and the WHO recommendation is calculated for each agglomeration. The average discrepancies are then averaged across all agglomerations and expressed in a standardised form with the WHO recommendation.
More detailed information: 'Luftbelastung in Ballungsräumen' (in German only).