ozone

Umwelt-Indikator

Indicator: Air quality in agglomerations

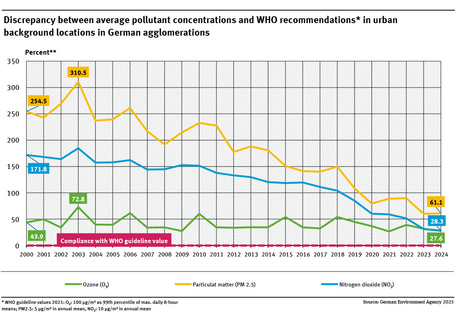
A graph shows how strongly, on average, urban background levels of three main air pollutants in German agglomerations exceeded World Health Organisation (WHO) recommendations between 2000 and 2021. The trend for the different pollutants varies. Between 2000 and 2021, the values for nitrogen dioxide were between 35.9 and -20,5 percent, for ozone between 71.0 and 46,8 percent and for particulate matter (PM2.5) between 77.3 and -5,7 percent.

The background level of one main air pollutant (ozone) in German agglomerations still exceeds World Health Organisation (WHO) guide line values.Close to sources, pollutant levels can even be significantly higher.The situation regarding nitrogen dioxide and particulate matter has greatly improved since 2000. In 2020, the mean value fell below the WHO recommendation for PM 2.5 for the first time.Ozo... read more

Air

Quick guide on how to use "Current air data" information pages

Experts at the monitoring stations of the German states and the German Environment Agency take multiple daily measurements to determine the air quality in Germany. Shortly after measurements are taken, you can go to our “Current air data” webpage to look up measured values, some forecast data, and data on past years. read more

Health

Special Exposure Situations

Smog during sunrise in Shanghai

Exceptional exposure situations deserve special consideration. They occur when usual or expected environmental conditions are not met. Human health is particularly at risk in these often extreme stressful situations, therefore environmental hygiene and environmental medicine take up a position on such topics. read more

The Umweltbundesamt

For our environment