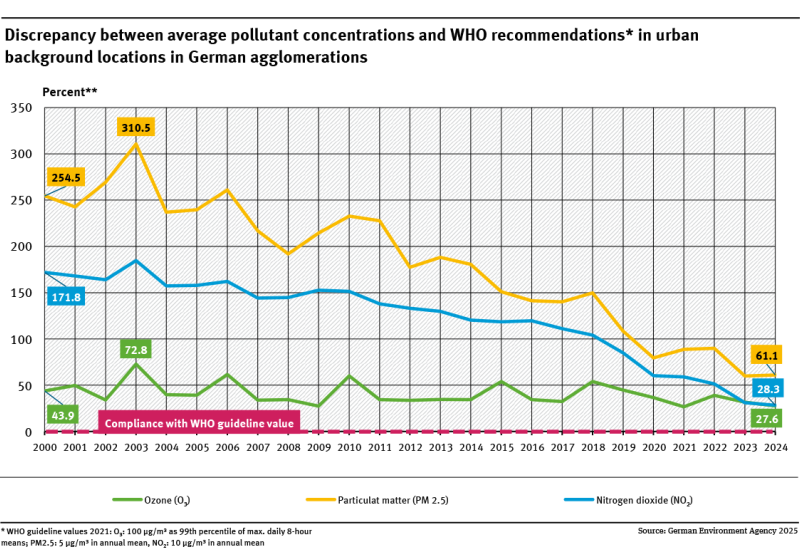
air quality population in agglomeration

Umwelt-Indikator

Indicator: Air quality in agglomerations

Two graphs show how strongly, on average, urban background levels of three main air pollutants in German agglomerations exceeded the old and the new WHO recommendations between 2000 and 2022. The trend for the different pollutants varies. With the new, stricter WHO recommendations of 2021 for nitrogen dioxide (NO2) and particulate matter (PM2.5), the distances to the target have become significantly greater. Between 2000 and 2022 the values for NO2 range between 172 and 52 %, for ozone between 44 and 39 %.

After the background level in German agglomerations exceeded the old recommendations of the World Health Organisation (WHO) only for the air pollutant ozone (figure left), the background level now clearly exceeds the updated WHO recommendations from 2021 also for particulate matter (PM2.5) and nitrogen dioxide NO2 (figure right).Close to sources, pollutant levels can even be significantly higher.T... read more

The Umweltbundesamt

For our environment