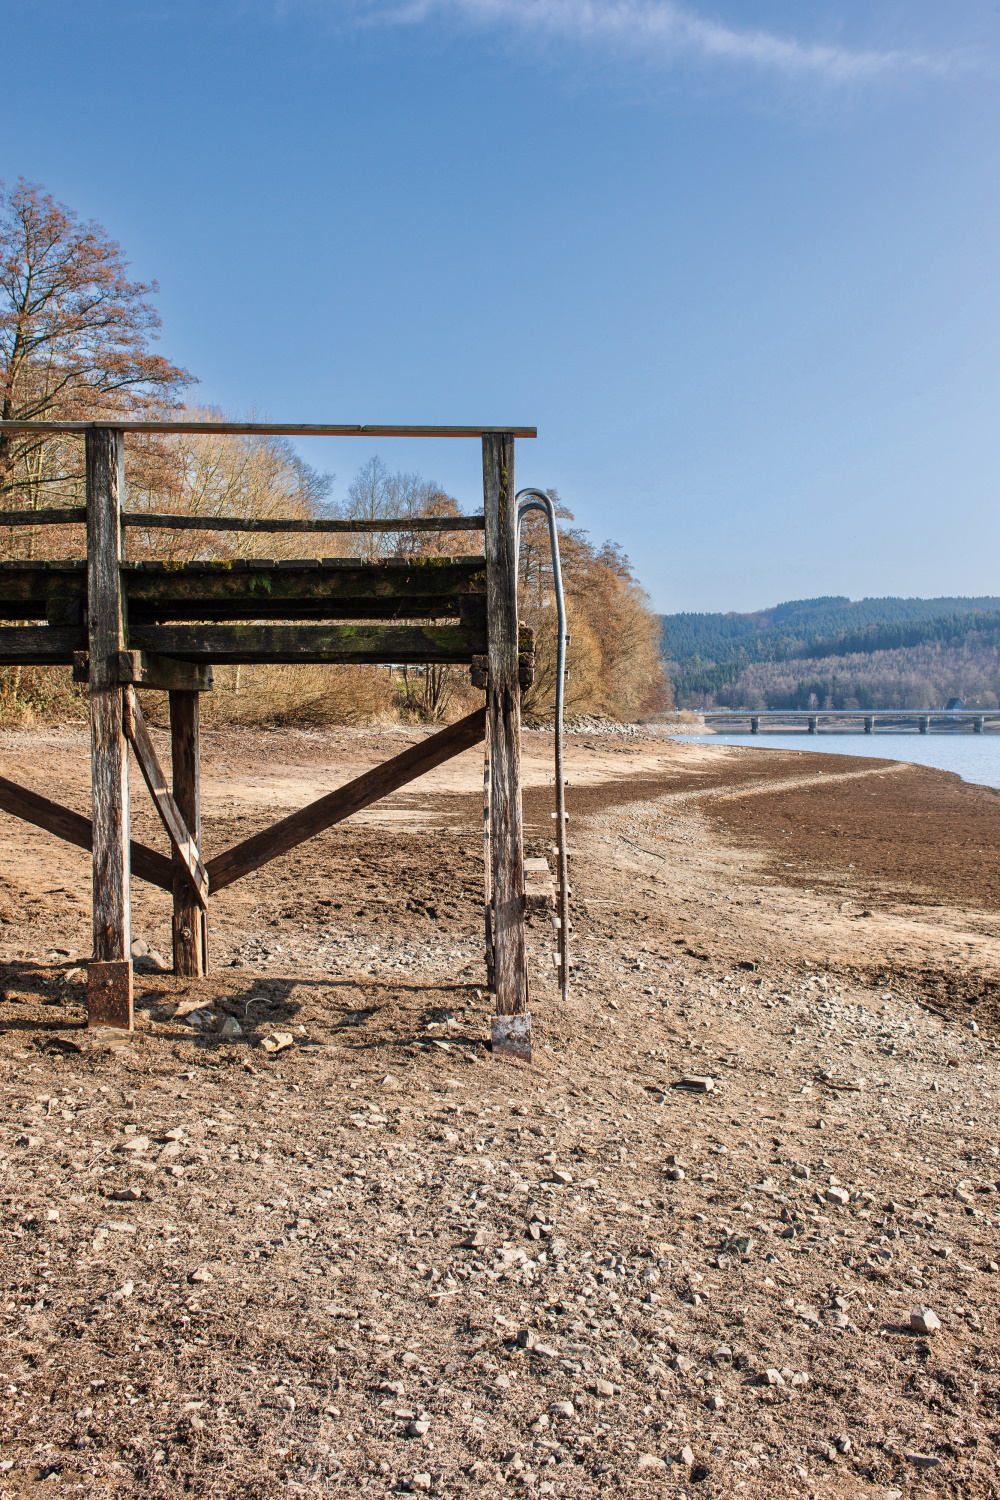
Negative water budgets are reflected not just in receding water levels of rivers; they also affect the water levels of lakes. Rising air and water temperatures (cf. Indicator WW-I-8) and the associated evaporation on land and from the water surface result in decreasing water volumes in lakes. If this scenario coincides with low precipitation levels, it will result in reduced inflows into the lakes concerned, either directly via surface discharge or indirectly via inflows from the groundwater61. Decreasing precipitation exerts a particularly strong influence on shallow lakes. When the water level of such lakes recedes, this also causes lake shores to dry out for many metres into a lake, thus resulting in footbridges projecting far beyond the surface of the water. This situation may lead to considerable impacts, for instance, on bathers or boating enthusiasts.
If water levels decrease considerably, this will entail a variety of ecological problems. Owing to the decline of the nesting belt on the shore, composed of various kinds of reed and floating-leaf plants, breeding areas for birds or spawning grounds for fish may be reduced in size or lost entirely. Likewise, species of the invertebrate fauna living in the shore area may be affected. When lake water volumes shrink, this can lead to an increased concentration of nutrients and pollutants and the water body heating up faster, with all the associated impacts on the stability of stratification and biogeochemical cycling, as well as the water quality and the water ecosystems (cf. Indicator WW-I-9). The higher water temperature in turn increases evaporation, thus leading to a self-reinforcing process of water loss.
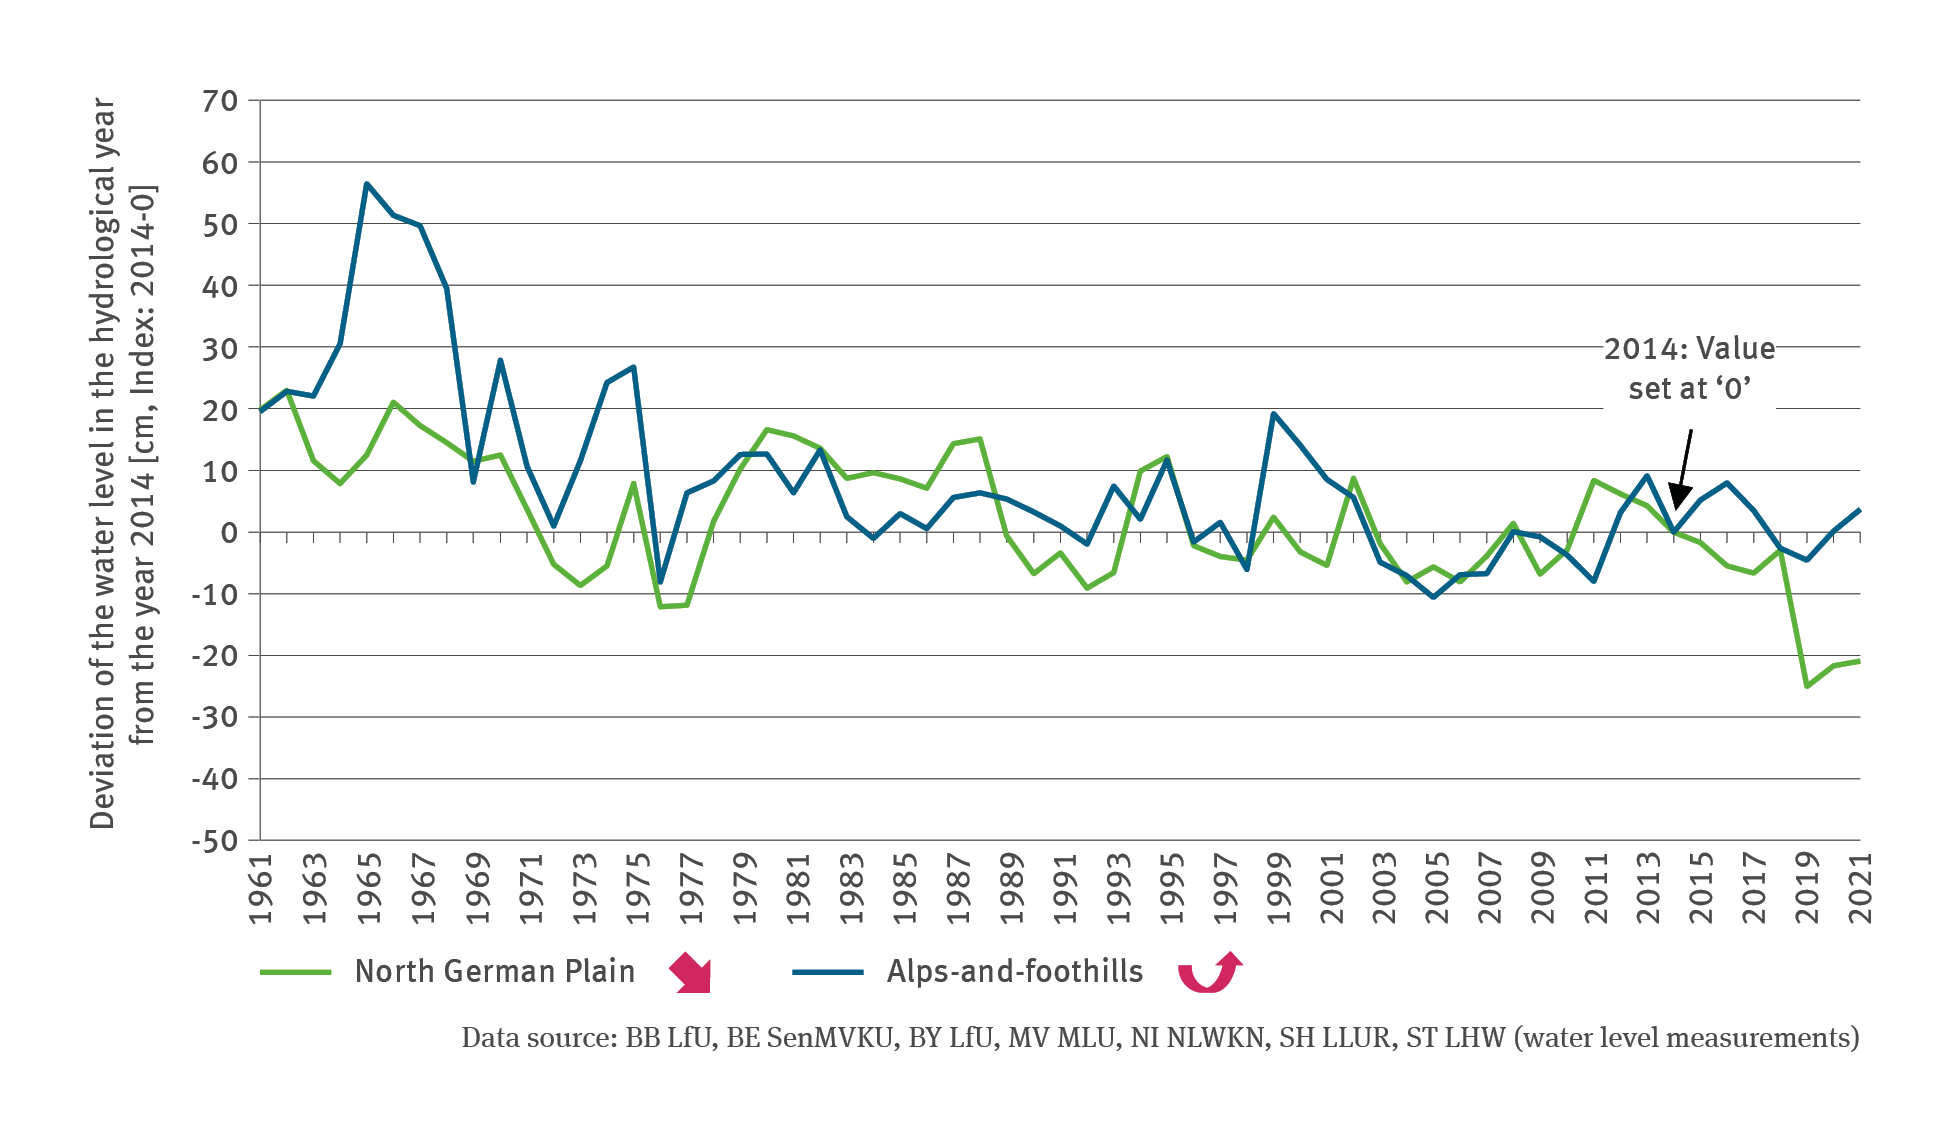
Long-term data indicating the water level of 21 lakes in the North German Plain – an area with an abundance of lakes – were evaluated for the indicator. A differentiation was made between large and deep lakes with catchment areas of different sizes in the Länder of Brandenburg, Berlin, Mecklenburg-Western Pomerania, Saxony-Anhalt and Schleswig-Holstein. For the equally lake-rich terrain of the Alps-and-foothills, data from ten Bavarian lakes were analysed. These lakes too were characterised by differences in their expanse and their catchment areas. As far as the uplands region is concerned, there have not been any suitable data made available so far. The majority of these lakes are artificial lakes, also called dams or reservoirs where water is retained by a barrage. The data regarding the small number of natural lakes (such as the so-called maars) are not available for sufficiently frequent observations and the time series are too short. However, for the Thuringian reservoirs, there are indications of regressive inflows from discharge, at least in the summer half-year62.
Given that the lakes are marked by very different morphological and ecological characteristics, it is not possible to calculate mean values in absolute figures covering these strongly differing lakes. Consequently, the indicator is based on indexed values. This means that for each lake a mean value is calculated using the deviations from the index year 2014, for which the water level value is set at ‘0’. This makes it possible to calculate the mean value for all the lakes concerned on the basis of these deviations. The year of 2014 was chosen as the index year in order to achieve an illustration which is analogous with the Indicator WW-I-8.
The lakes in the North German Plain are largely fed by groundwater. This means that water levels in the lakes recede to the same extent as groundwater diminishes. This is shown very clearly by the data as there are distinct matches between the two data sets. In the years of 1976–1977, 1992–1993, 2004–2006 and 2019–2021, when the time series clearly showed negative deviations of the lake water levels from the index year 2014, there was also a particularly high number of months with non-attainment of the long-term mean of the lowest groundwater levels in the northern regions (cf. Indicator WW-I-2) The greatest decrease in water levels occurred during the very dry and hot years of 2019 and 2020. For instance, in April 2018, the Groß Glienicker lake in Berlin went into decline with a level of 192 cm during the drought period. By October 2018, the level had dropped by more than half a metre to just above 140 cm. The lowest level was reached in October 2020 with 110 cm. The situation was similar in the Müritz lake in Mecklenburg-Western Pomerania – from 227 cm in April 2018 the water level dropped to all of 159 cm in October 2018 – and also in the Dümmer lake in Lower Saxony where the water level dropped during the same period from 221 to 166 cm. In the Parsteiner See – the third-largest natural lake in Brandenburg – the water level had receded so much by the end of 2020 that the measuring gauge became almost completely dry. The water level had practically dropped down to almost zero. When this gauge was first fitted, nobody would have expected that the water level would ever drop as low as this. While in 2021 the water levels in most lakes went up again, there are, however, some lakes – such as the Drewitzer See in Mecklenburg-Western Pomerania – which retained a very distinctly low water level even as late as the end of 2021.
Contrary to the lakes in northern Germany – in the lakes in the Alps-and-foothills, the inflow from surface discharge plays a far greater role. To some extent, these lakes are in alpine catchment areas, which means that snow and snow melt have a greater influence on water levels. Besides, precipitation is in general higher in the Alps-and-foothills. But even there, receding water levels have been observed in the lakes since 1961. However, the impacts of recent drought years were distinctly less incisive with regard to diminishing water levels and were offset by persistent precipitation. In January 2019 the Alps and their marginal areas experienced snow masses to an extent not seen for a very long time. In May 2019 there was a period of very heavy, persistent rain in the southern part of Swabia and in much of Upper Bavaria. And in 2020 the south of Bavaria also experienced several periods of abundant precipitation.
61 - Prange M., Wilke T., Wesselingh F. 2020: The other side of sea level change. Communications Earth & Environment 1, 69. doi: 10.1038/s43247-020-00075-6
62 - TMUEN – Ministerium für Umwelt, Energie und Naturschutz 2022: Klimawandelfolgen in Thüringen – zweiter Monitoringbericht. Erfurt, 188 pp. https://umwelt.thueringen.de/aktuelles/anzeigen-medieninformationen/klimaveraenderungen-und-ihre-folgen-in-thueringen