The highest number of hot days averaged across Germany were recorded in 2003, 2015, 2018 and 2022.Despite considerable fluctuations between individual years, the overall trend is rising significantly.More hot days are expected during summer months in the coming decades due to climate change. read more
indicator
Umwelt-Indikator
Indicator: Species diversity and landscape quality
The indicator is at 80 percent in 2023 and close to the target range.The values of the sub-indicators agricultural land and coasts and seas are still far from the target range.The German government aims to increase the indicator to 100 percent by 2030. This can only be achieved with considerable additional efforts. read more
Indicator: Raw material footprint
Primary raw material use per capita, or the raw material footprint, decreased only by 3 % between 2010 and 2022.These figures include raw materials which were required for the production of consumed goods at home and abroad.German raw material consumption is too high by international comparison and is to be reduced further. read more
Indicator: Landscape dissection
The data on undissected low-traffic areas are used to describe the fragmentation of the landscape by transport routes.In 2015 undissected low-traffic areas accounted for 23.5 % of Germany’s total land area.The target of the Federal Government is to retain a proportion of 25.4 %. read more
Indicator: Recycling municipal waste
The recycling rate for municipal waste rose from 56 % in 2002 to 67.2 % in 2023.The target set by the Federal Government of increasing the recycling percentage for municipal waste to 65 % by 2020 has therefore been achieved.However, there is still a need for action for individual subgroups of municipal waste. read more
Indicator: Amount of waste – municipal waste
The volume of municipal waste fluctuates only slightly over time. In 2023 it stood at 48.9 million tonnes.The target of environmental policy is the avoidance of waste generation.This target has not been achieved for the municipal waste. To reduce resource consumption, municipal waste has to decline. read more
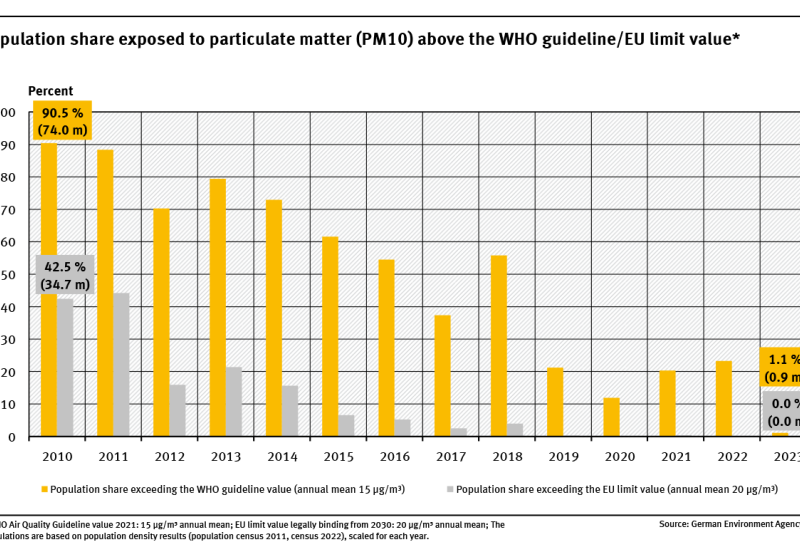
Indicator: Population exposure to particulate matter (PM10)
Between 2010 and 2023, the proportion of the population exposed to annual average PM10 concentrations above the WHO guideline value of 15 µg/m³ decreased from 90.5 % to 1.1 %.Since 2019, the share of the population exposed to PM10 levels above the EU limit value of 20µg/m³ (legally binding from 2030) has been below 0.5 %—and in 2023, it was 0 %.Current measures should be mainta... read more
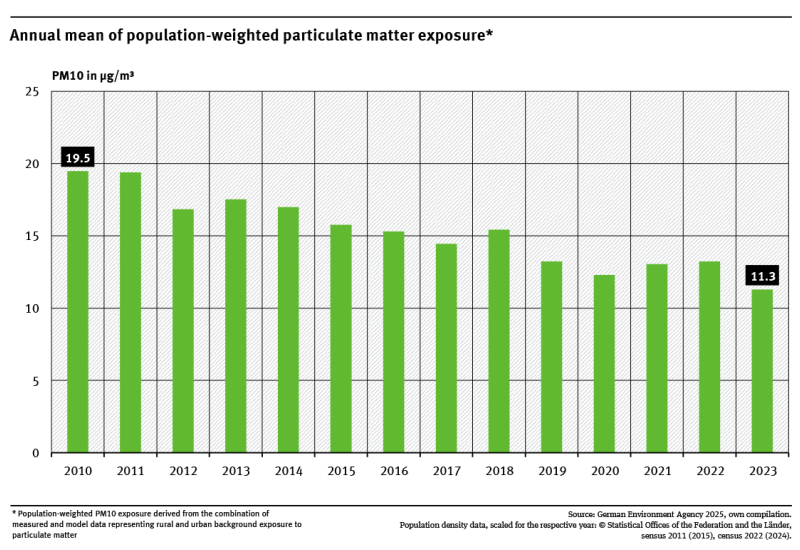
Indicator: Population-weighted particulate matter exposure (PM10)
Population-weighted exposure to PM10 in Germany was significantly lower in 2023 than in 2010.In 2023, the population-weighted PM10 exposure was 11.3 µg/m³—approximately 42 % lower than in 2010.This decline in exposure is due to decreasing emissions from stationary sources (such as power plants, waste incineration facilities, residential heating, and industrial plants) as well as measures implement... read more


