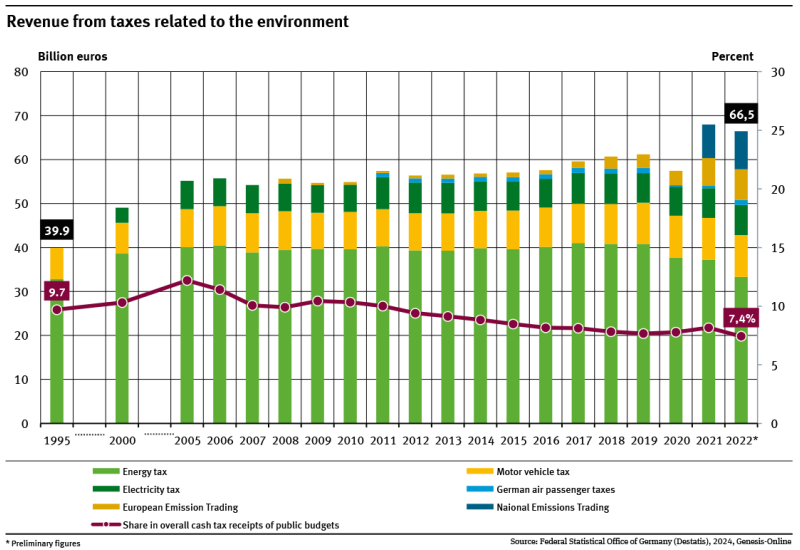
The most important environmental taxes are energy, motor vehicle and revenues from national emissions trading.In 2022, environmental taxes amounted to a total of 66.5 billion euros.The share of total taxes has been on a downward trend since 2005 and now stands at 7.4 %. read more
Umwelt-Indikator
Indicator: Taxes related to the environment
Indicator: Nitrogen eutrophication

69 % of vulnerable ecosystems in Germany are threatened 2019 by excess nitrogen deposition.With the revised German Sustainable Development Strategy 2016, the Federal Government aims to reduce the proportion of these areas by 35 % until 2030. According to the current calculation basis, this results in a target value of 52 % by 2030.This target is feasible only if efforts to reduce air pollution are... read more
Indicator: Recycling municipal waste
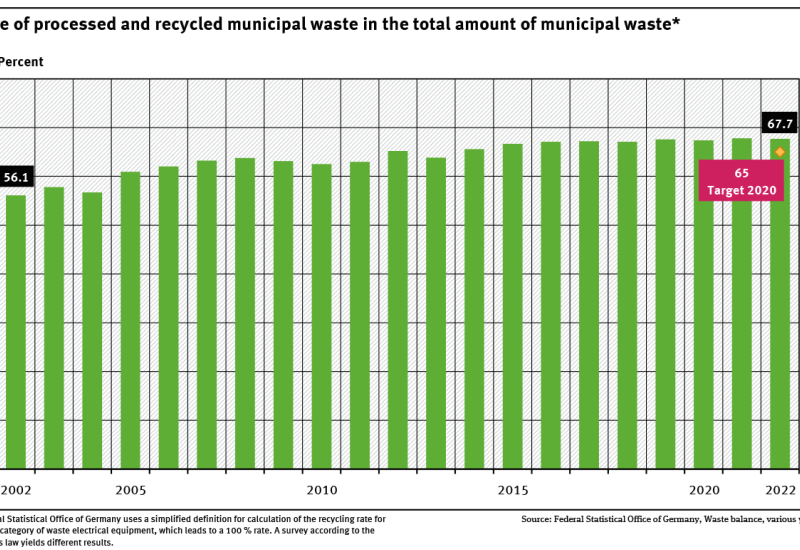
The recycling rate for municipal waste rose from 56 % in 2002 to 67.7 % in 2022.The target set by the Federal Government of increasing the recycling percentage for municipal waste to 65 % by 2020 has therefore been achieved.However, there is still a need for action for individual subgroups of municipal waste. read more
Indicator: Amount of waste – municipal waste

The volume of municipal waste fluctuates only slightly over time. In 2022 it stood at 48.6 million tonnes.The target of environmental policy is the avoidance of waste generation.This target has not been achieved for the municipal waste. To reduce resource consumption, municipal waste has to decline. read more
Indicator: Energy consumption in manufacturing

Energy consumption in manufacturing hardly changed at all between 1995 and 2022.In 2022, energy consumption in the industry sector amounted to 3,767 Petajoules, which was roughly the same level than in previous years. Since a peak in 2017, the values have fallen every year.Germany’s primary energy consumption should fall by 50 % by 2050. The manufacturing sector will have to contribute to it. read more
Indicator: Greenhouse gas emissions in industry

Greenhouse gas emissions of the manufacturing industry fell by around 35 % between 1995 and 2023.Over the same period, productivity in the manufacturing industry grew by about 46 % (adjusted for price).Germany is aiming for greenhouse gas neutrality by 2045. read more
Indicator: Organic farming

According to the data of the German Federal Statistical Office, the share of area under organic farming of agricultural land increased from 2.9 % to 11.2 % from 1999 to 2023.The Federal Government aims to increase the proportion of organically cultivated areas in agricultural land to 30 % by 2030.At the growth rate of recent years, this aim is expected to be missed in 2030. read more
Indicator: Environmental protection goods

Approximately 6 % of industrial production in Germany are used to protect the environment, e.g. for noise protection or climate mitigation.In 2021, potential environmental protection goods worth nearly 90.6 billion euros were produced in Germany.At 43 billion, climate protection accounts for the largest share. read more
