Indicator: Global surface temperature

A graph shows the deviation of the global air temperature between 1850 and 2023 from the average global air temperature from 1850 to 1900, which is taken as the baseline period. 2023 was 1.5 degrees Celsius warmer than the baseline average.Click to enlarge
Deviation from global mean surface temperature 1850 to 1900
Source: Met Office Hadley Centre Figure as PDF

Table of Contents


At a glance

  • 2023 was the warmest year worldwide since records began 1850.
  • The last nine years have been the warmest years worldwide since 1850.
  • The Paris Agreement stipulates that the increase in global temperature should be limited to well below 2 °C above pre-industrial levels, and even to 1.5 °C. Due to historical data availability, the comparative period used by WMO for this purpose is 1850 to 1900.
 

Environmental importance

Climate change manifests itself as an increase in the global average surface temperature. But we are also seeing ocean temperature and acidity on the rise, increases in weather variability and damages and frequency of extreme weather events such as heavy precipitation, heat waves and droughts. Germany as well has growing warmer and hotter over the years, and more so than the global average. As a result, the number of hot days increases (cf. 'Hot days' indicator). The increase in average temperatures is also changing the duration of individual seasons. As of yet we have only a partial understanding of the complex effects of these seasonal shifts on plants and animals.

The global annual mean temperature alone is of little climatological significance. We obtain more information from a given year's global mean deviation from the average for a longer period in the past. This shows whether one year was warmer or cooler than the climatological average. Usually a comparison is made with the period 1850 to 1900, which is also used by the WMO.

The 'German Strategy for Adaptation to Climate Change' envisages climate impact monitoring (BReg 2008). Climate change impacts and adaptation in different areas are published in a monitoring report which is updated every four years.


Assessing the development

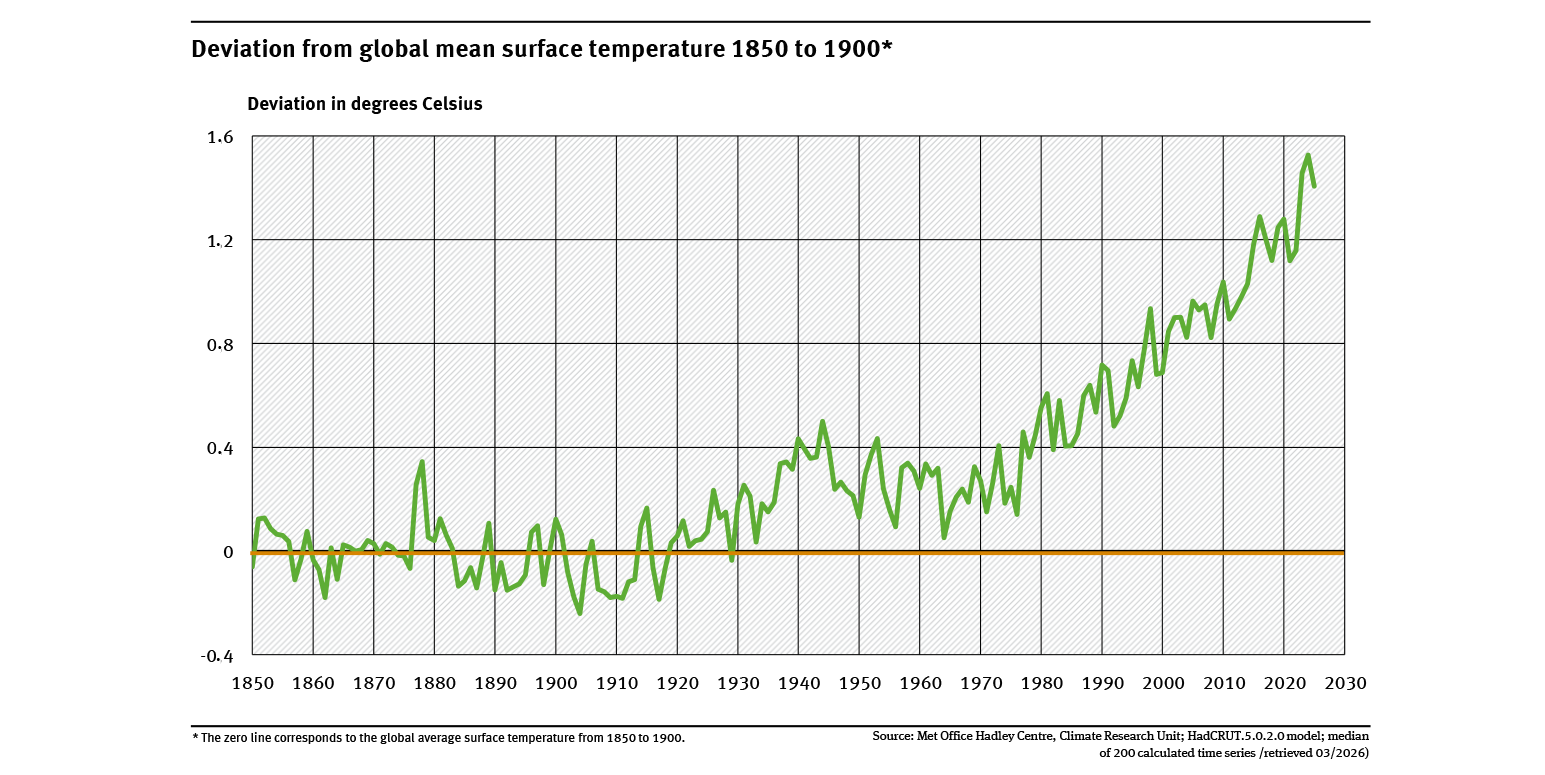
To prevent dangerous interference to the climate system, the aim is to limit the temperature increase to well below 2 degrees Celsius (°C) above pre-industrial levels, and even to 1.5 °C. This is the Paris Agreement adopted by the global community at the 2015 Climate Conference in Paris (UNFCCC 2015). To meet this target, global greenhouse gas emissions must be reduced rapidly and substantially (cf. ‘Greenhouse gas emissions’ indicator), to achieve global greenhouse gas neutrality by 2050 at the latest.

In 2023, the global mean of ground-level air temperature was about 1.5 °C above the mean from pre-industrial times, according to WMO calculations. This made 2023 the warmest and hottest year ever recorded, with a very small gap to the previously warmest year. The last nine years were the warmest years worldwide since 1850.


Methodology

The Hadley Centre's temperature data form part of an internationally recognised body of temperature datasets. As with other available datasets, the global average surface temperature is based on measurement data from meteorological stations. The global average surface temperature is calculated from worldwide measurements using a combination of calculation rules and interpolations with the HadCRUT5 model (Morice et al. 2021). In addition to the HadCRUT5 data shown here, the WMO also uses time series from other institutes, including ECMWF, NASA, NOAA, and JMA.

More detailed information: 'Trends der Lufttemperatur' (in German only).