The water temperature of standing waters is influenced very directly by the air temperature. It hence follows that changes in water temperature are part of the direct impacts of climate change. Water temperature is one of the key influencing variables affecting the physical, chemical and biological processes occurring in lakes and reservoirs. It influences major factors such as the duration of ice cover and the mixing and stratification conditions. The reaction speed of numerous chemical and bio-chemical processes accelerates at higher temperatures: For example, salts dissolve more easily in warmer water, whereas gases such as oxygen take longer. Some organisms can cope with low oxygen content or high mineral concentration whereas others are dependent on excellent water conditions. Apart from an increase in the water temperature itself, the material changes triggered by the rise in temperature also have a considerable influence on plants and animals in water bodies, also on the composition of species communities as well as on the structures and functions of food webs in the ecosystems of water bodies.
Many creatures occurring in water bodies are adapted to specific temperature conditions. Therefore, even minor changes can entail shifts in the species composition in standing water bodies. This may result in the displacement of originally occurring organisms by other species, including allochthonous species which benefit from the increased temperatures. Furthermore, these circumstances can also lead to changes in the cycle of the seasonal development of living organisms in the ecosystem. For example the onset of algal development in spring (cf. Indicator WW-I-9) is influenced strongly by water temperature. In eutrophic waters, thermophilic, toxin-forming cyanobacteria can occur in increased concentrations in summer, causing health problems to bathers (cf. Indicator GE-I-6).
There are more than 12,000 natural lakes in Germany63. Depending on their geographical location, and on the natural spatial conditions, these lakes are fundamentally different in terms of trophic relationships, water flows and water body depth. In order to obtain a nationwide overview of the development of water temperatures at the same time as acknowledging, as far as possible, the special features of different lake types, a differentiation is made between the 38 lakes and reservoirs considered in the indicator, in respect of the three major ecoregions of the Alps-and-foothills, the central uplands and the North German Plain.
The lakes of the North German Plain are characterised by warmer and calcium-rich inflows. The spectrum ranges from lakes shaped by the ice age with depths up to 70 metres as for instance in respect of the Stechlinsee and to polymictic lakes such as the Große Müggelsee which – owing to their relatively minor depth of water – do not have any lasting thermal stratification phases, and to very shallow river lakes such as the Untere Havel or the Große Wannsee. The last-mentioned are basically lake-type, mostly elongated extensions of rivers. Owing to their specifics they are illustrated separately in the indicator. Given that in the area of the central uplands, there are only few sizable natural lakes, reservoirs were included in this group – to make it possible to illustrate this region. However, only those reservoirs were considered in which no water is abstracted from the uppermost water strata which is where the temperature data are collected. The lakes in the Alps (such as the Königsee) and the foothills of the Alps (such as the Ammersee, Chiemsee, Schliersee, Starnberger See, Tegernsee and Lake Constance) are all stratified lakes, predominantly with extensive catchment areas and usually also with a great depth of water. They are fed distinctly and predominantly from streams and minor rivers which have their sources in the Alps and are comparatively cold.
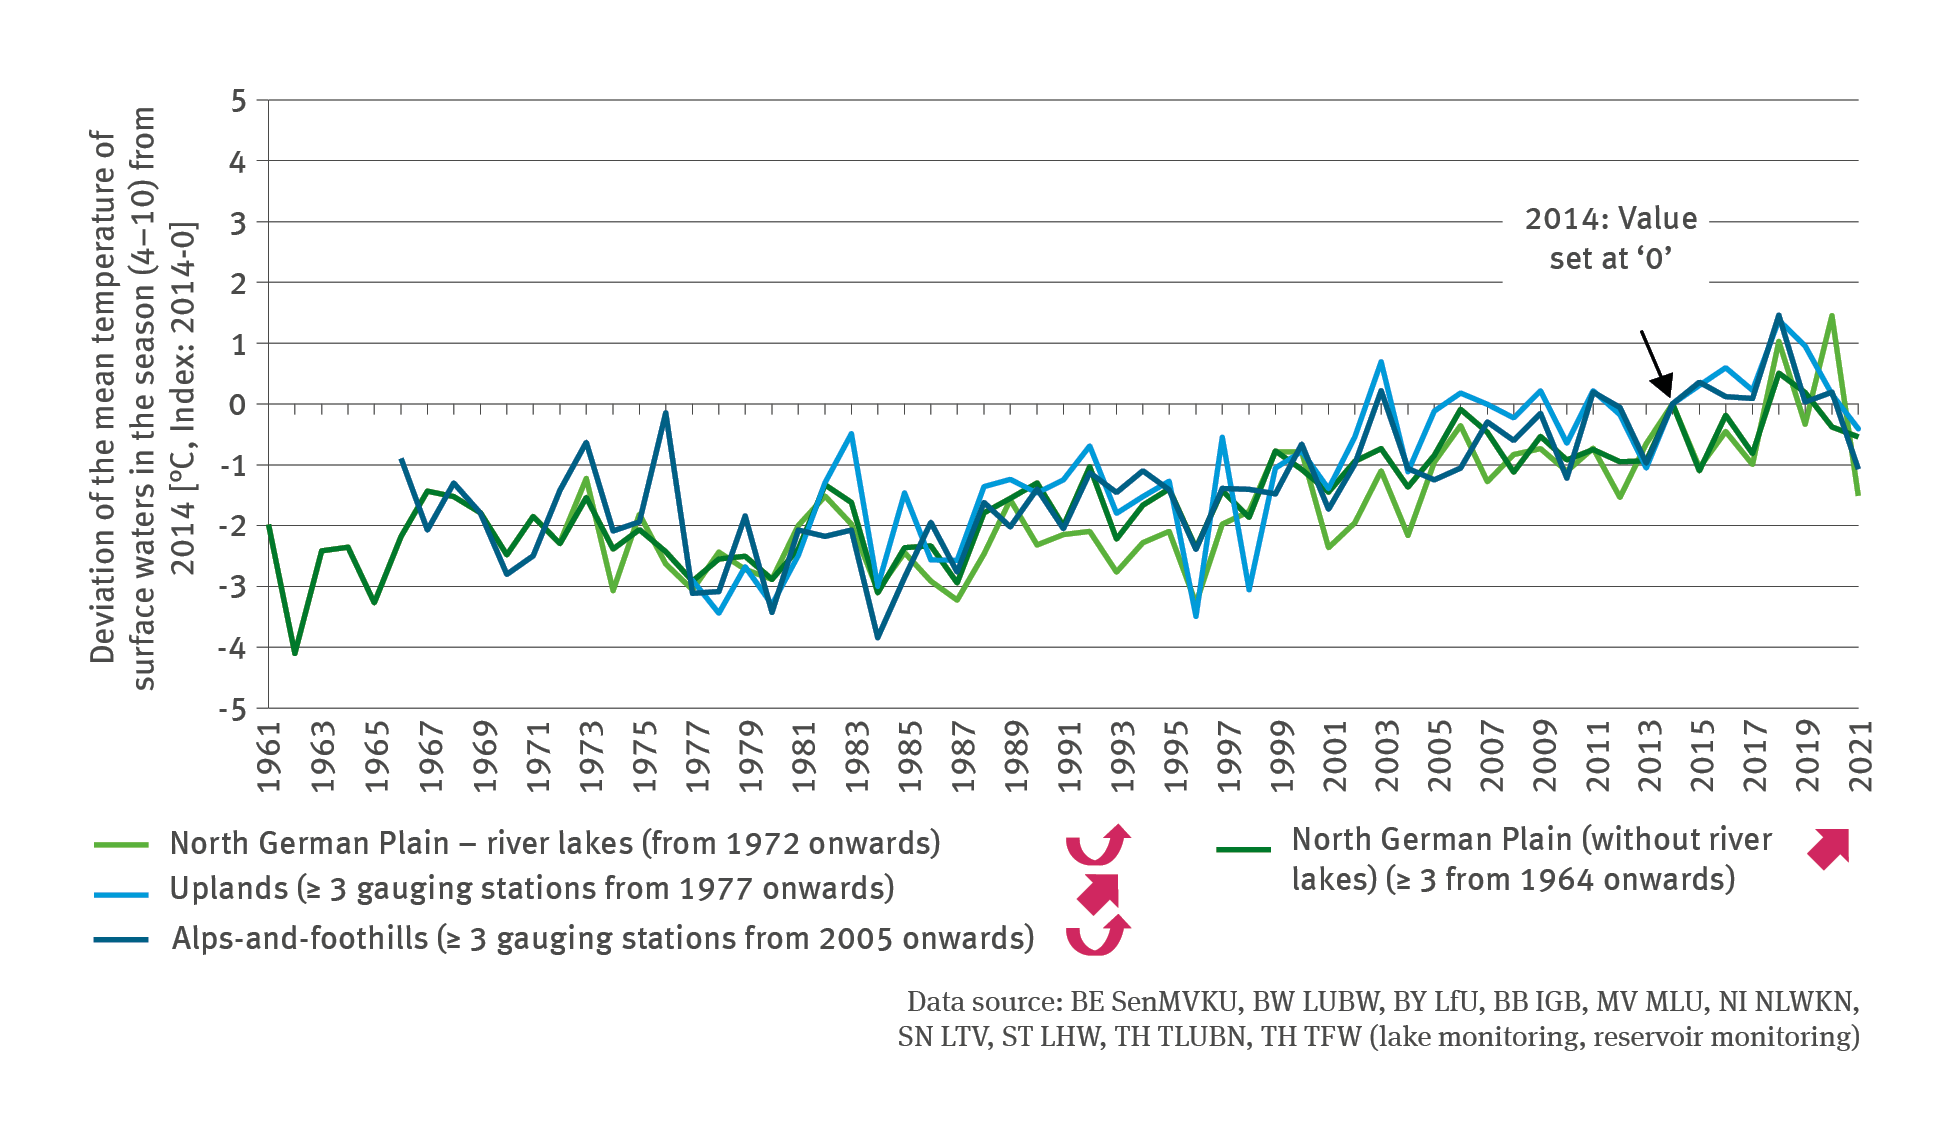
The temperature levels of these types of lakes vary. While the river lakes – in the decade prior to the extreme years of 2018 to 2020 – reached temperature means for the season from April until October of roughly 17.7 °C, the lakes of the North German Plain (except for the river lakes) reached mean values of roughly 16.5 °C. The reservoirs in the uplands and the lakes in the foothills of the Alps averaged approximately 16 °C whereas the Königsee – the coldest of all lakes considered – reached barely 13 °C. Given the different temperature levels of the lakes (including those within the regions), it would not make much sense to calculate straightforward mean values based on the absolute temperature data across the lakes. Consequently, the indicator – in the same way as the indicator for the water level (cf. Indicator WW-I-7) – is based on indexed values: For each lake a mean value is calculated using the deviations from the index year 2014, for which the temperature value is set at ‘0’. The values of these deviations are used to calculate the mean value across all the lakes. 2014 is the earliest year for which data are available from all the lakes considered.
The data used for illustration in the indicator emanate from measurements taken in the uppermost epilimnion, in other words, from a water depth down to 50 cm. This layer is usually well mixed and reacts comparatively directly to any changes in the air temperature. By contrast, the development of water temperatures in the deeper hypolimnion – depending on the stratification pattern of individual lakes – can be very different for each lake, and the relationships with climate change are distinctly more complex.
The water temperatures of all the lakes considered in those three regions, have been rising significantly during the relevant periods of observation. Years with above-average high air temperatures such as the years of 2003, 2018 and 2019 stand out quite conspicuously in all regions. It is important to bear in mind that water temperatures are raised, above all, by extended heatwaves. For example, a few hours per day with great heat of more than 30 °C make less of an impact on the temperature of the water body than for instance permanently mild night temperatures of more than 20 °C: Furthermore, the intensity in which the upper water strata are mixed, play a role: Overall, high temperatures combined with high wind produce higher warming effects than heat on a calm day.
63 - Informationen des UBA – Umweltbundesamt zu Seen: https://www.umweltbundesamt.de/themen/wasser/seen#wissenswertes