WW-I-5: Peak discharge values in watercourses
 Click to enlarge
Source: murat / stock.adobe.com
2023 Monitoring Report on the German Strategy for Adaptation to Climate Change
Click to enlarge2023 Monitoring Report on the German Strategy for Adaptation to Climate Change
Depending on the location and use of the areas threatened by flooding, extreme floodwater discharge events can lead to serious material damage and personal injury. The most extreme flood events so far occurred in the summer months when heavy or persistent rain entailed that the landscape was unable to retain the volumes of water anymore. It can happen that in the case of individual gauging stations, the long-term MHQ is exceeded by a factor of more than 8 or 9.
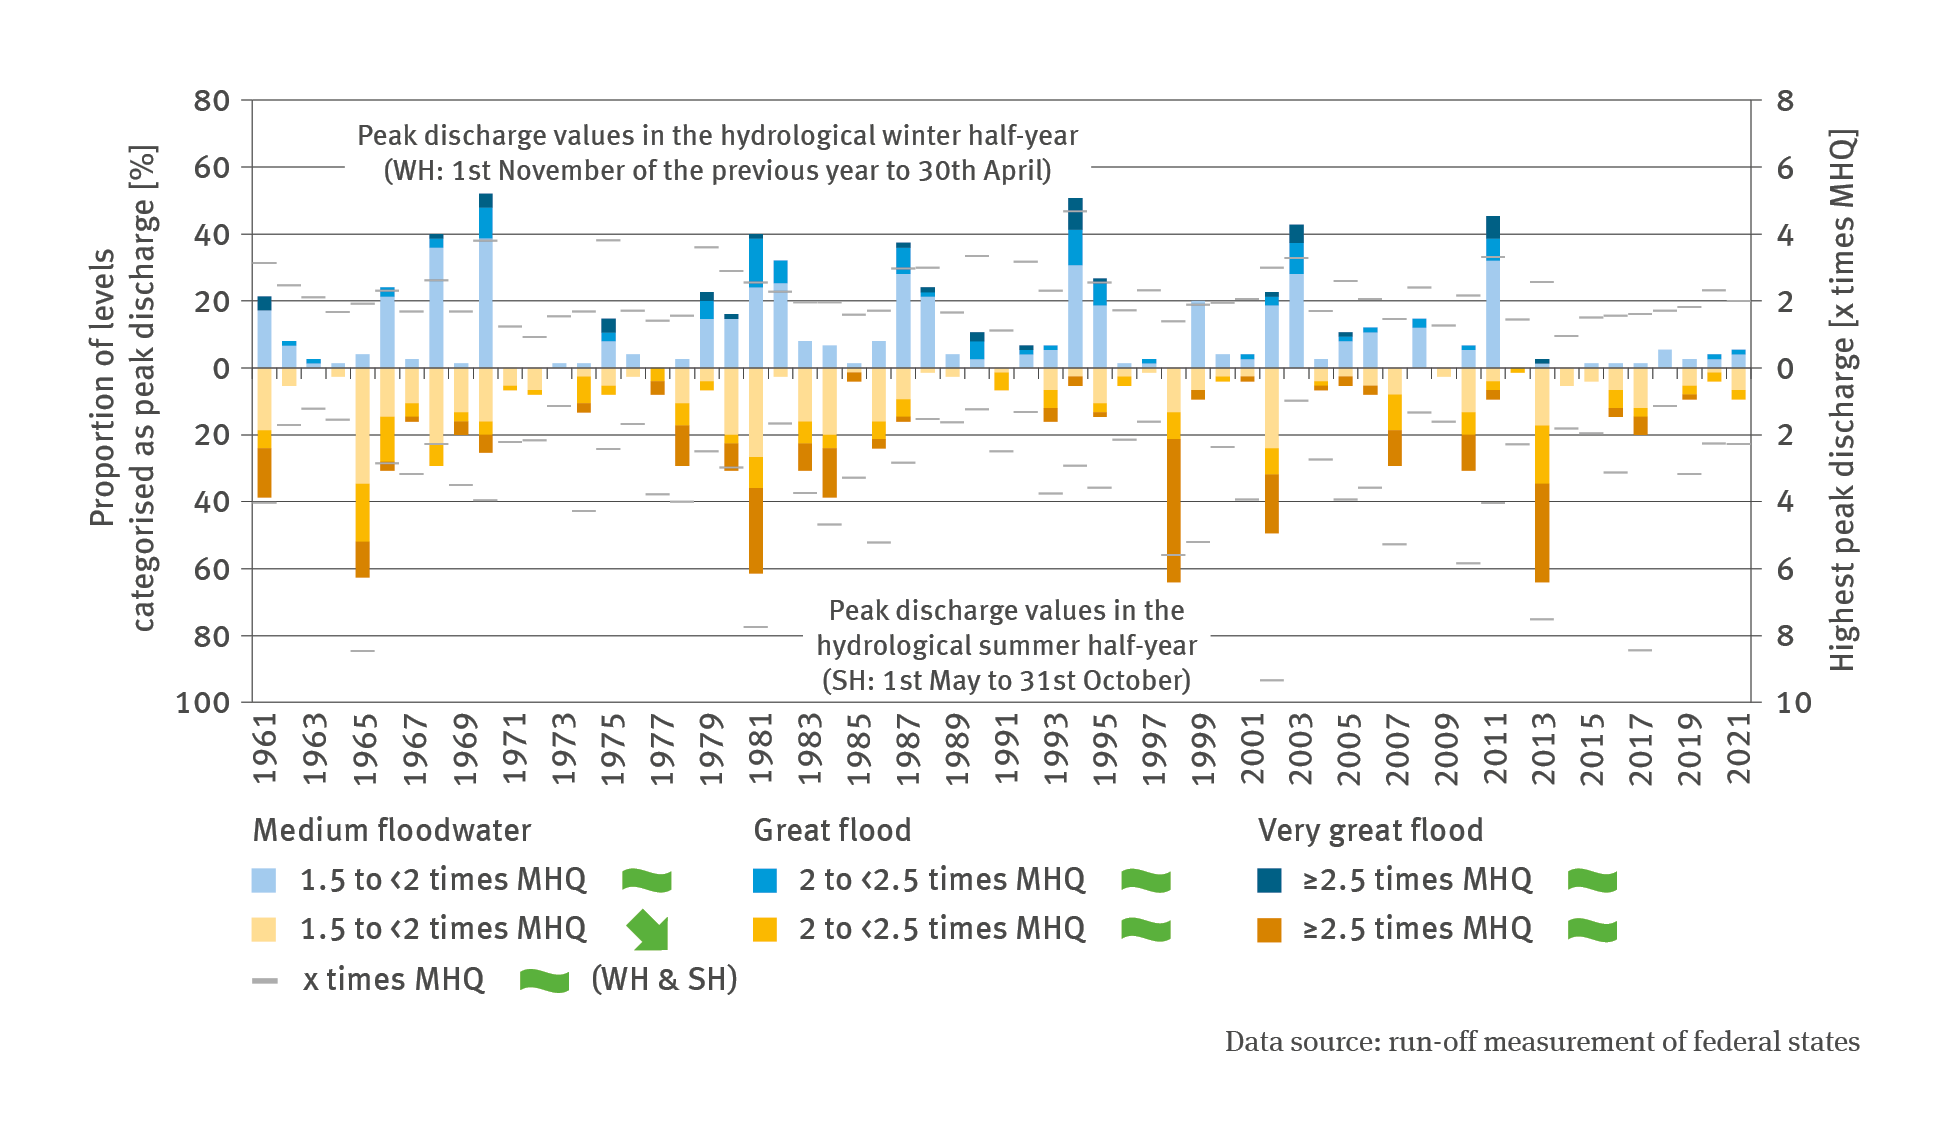
The bar chart WW-I-5 ‘Peak discharge values in watercourses’ contains a biaxial diagram. The bar chart shows for the years 1961 to 2021 – separately for the hydrological winter half-year (1st November of the previous year to 30th April) and the hydrological summer half-year (1st May to 31st October) – on one hand the highest peak discharge at selected watercourse gauges as a multiple of MHQ. On the other hand, the chart shows the proportion of the levels measured at the gauging stations concerned, categorised as medium flood (factor 1.5 to less than factor 2 times MHQ), great flood (factor 2 to less than factor 2.5 MHQ) as well as very great flood (factor 2.5 MHQ and higher). Peak discharge events occur above all in hydrological summer half-years; they can reach as much as factor 8 to 9 times MHQ. The highest value occurred in the summer of 2002 with almost a factor of 10 times the MHQ. Only the proportion of levels measured in a medium flood in the hydrological summer half-year decreased significantly between 1961 and 2021.
The indicator in respect of floodwater days (cf. WW-I-4) does not permit any statements on the severity of the flood events concerned. Floodwater days are those days on which the long-term mean floodwater discharge (MHQ) was exceeded at the gauge in question, regardless of the actual amount of exceedance.
Extreme flood events – depending on where they occur and the degree of water utilisation in the areas threatened by flooding – can lead to serious material damage and personal injury (cf. Indicator BAU-I-5). The designation of flood plains and the dimensioning of flood protection measures are often based on a 100-year flood event (HQ100), in other words, a flood event that, statistically speaking, occurs at least once in 100 years. As far as extreme flood events are concerned which exceed the HQ100 concept, this type of flood protection is not sufficient in most cases.
Putting it simply, it can be assumed that an exceedance factor of 1.5 times or less than twice the MHQ is equivalent to a repeat interval of five (HQ5) to 20 years (HQ20). An exceedance of MHQ by a factor of 2 to less than 2.5 is equivalent to a discharge event which, according to past observations, occurs roughly between once every 20 years (HQ20) and once every 50 years (HQ50). If there is floodwater discharge equivalent to at least a factor of 2.5 times the MHQ, this would be equivalent to a discharge event that occurs less frequently than once in 50 years. It has to be borne in mind, however, that the occurrence of extreme floodwater can change the statistics. For instance, it is possible that a single HQ100 event turns into HQ50.
The data analysis of peak discharge values demonstrates that the extreme flood events occur primarily during the summer months. In other words, this is the time of year when events occur which exceed HQ50. Even the most extreme cases of exceedance with factors of 8 or 9 times the MHQ occurred in the summer half-year. Statistically speaking, there are so far no significant trends discernible, with the exception of a decrease in the proportions of floodwater levels categorised as medium in the summer half-year. However, years such as 1998 and 2013 stand out, when in many cases floodwater levels at many gauging stations had to be categorised as very high. In 1998, the month of October – usually known as a less rainy month – was characterised by extreme amounts of rainfall. It was the wettest October since the beginning of the systematic recording of weather data. There was flooding in various locations in Germany – the flooding in the catchment areas of the rivers Weser, Aller and Leine was particularly extreme. In 2013 the floodwater forced its way alongside the Danube, Saale, Elbe and other rivers, bulldozing a path throughout large parts of Germany: Bavaria, Thuringia, Saxony, Saxony-Anhalt, Brandenburg, Mecklenburg-Western Pomerania. Lower Saxony and Schleswig-Holstein bore the brunt.
It is also important to remember in respect of this indicator, that the 2021 flood disaster in the Ahr and Erft river basins is not reflected in the data, as the relevant gauges are not part of the selection of gauging stations for the Monitoring indicator. The July 2021 flooding was triggered by excessively heavy rain events. Especially in parts of North Rhine-Westphalia and Rhineland-Palatinate precipitation rates up to 100 litres per square metre were measured within 72 hours, locally even more than 150 litres per square metre in 24 hours. The extreme amounts of precipitation made especially the smaller water bodies swell fast and made them break their banks. When such extreme flood events occur, it can in fact happen that gauges are completely destroyed so that data are not available for the purpose of recording.
In addition, the indicator shows the highest amounts of MHQ exceedance attained in the relevant years at the relevant gauging stations. This means that typically the value is ‘supplied’ by a different gauging station every year. In 2002 the reading emanated from the gauging station at Lichtenwalde in the municipality of Niederwiesa in Saxony. The flooding which occurred during the flood event of August 2002 was particularly grave in the Mulde basin. The highest daily mean discharge measured amounted to a factor of 9.3 times the long-term MHQ of this gauging station.
In July 2017 the peak value compared to all other levels was reached in Bad Salzdetfurth in Lower Saxony. Precipitation of up to 220 litres per square metre (l/m²) in the course of three days resulted in the rivers Alme, Riehe, Lamme and Innerste rising to levels never attained before. The impacts of this flood were devastating.
In 2013 the gauging station at Zeitz on the Weiße Elster in Saxony-Anhalt supplied the peak value. After persistent rain on 3rd June, the local MHQ was exceeded by a factor of 7.5 at that gauging station.
The UBA’s motto, For our environment (“Für Mensch und Umwelt”), sums up our mission pretty well, we feel. In this video we give an insight into our work.