Indicator: Hot days

A graph shows the number of hot days in the areal mean for 1951 to 2023. Although the trend varies greatly, the increase is clearly visible. A trend line has also been plotted on the graph which shows a significant rise.Click to enlarge
Number of days when maximum air temperature exceeds 30 degrees Celsius (areal mean)
Source: Deutscher Wetterdienst Figure as PDF

Table of Contents


At a glance

  • The highest number of hot days averaged across Germany were recorded in 2003, 2015, 2018 and 2022.
  • Despite considerable fluctuations between individual years, the overall trend is rising significantly.
  • More hot days are expected during summer months in the coming decades due to climate change.
 

Environmental importance

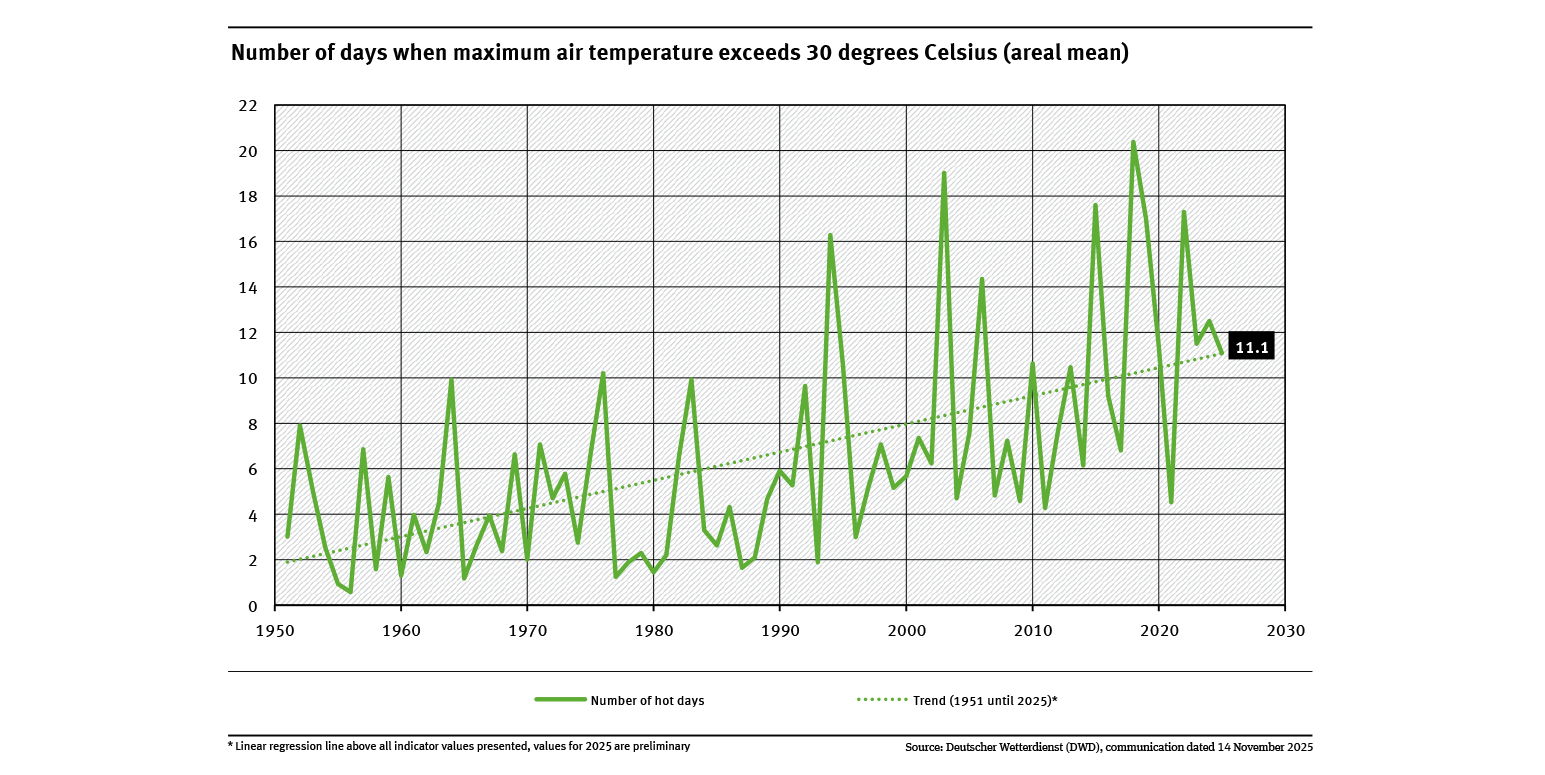
Rising temperatures can adversely affect human health. Germany's National Meterological Service, the Deutscher Wetterdienst (DWD), defines the ‘hot day’ as any day on which the maximum temperature exceeds 30 degrees Celsius (°C).

High air temperatures have a direct impact on the human body, as the heat can cause circulatory problems. Indirectly, hot weather can raise pollutant levels in the air we breathe, leading to an increase in respiratory and circulatory diseases. High air temperatures combined with intense sunlight encourage the formation of ground-level ozone. Ozone irritates the eyes and airways and can exacerbate existing respiratory diseases. It can also trigger allergic reactions.


Assessing the development

In 2023 Germany recorded about 11.5 ‘hot days’, when temperatures exceeded 30 °C.

The strain on heat was also particularly high in 2003, 2015 and 2018: in these years there were between 18 to 20 ‘hot days’ on a nationwide average. The ten hottest years based on the number of hot days all have been recorded since 1994. Although the annual figures for this indicator vary greatly, the overall trend has increased significantly since records began.

Climate models show that in the future Germany can expect an increase in the number of hot days in summer and more prolonged heat waves.


Methodology

The indicator is based on temperature measurements taken at Deutscher Wetterdienst (DWD) monitoring stations. Temperature readings and indicator values must be calculated for those areas not covered by monitoring stations. The results can be presented in a grid (1×1 km) which shows the distribution. An annual total of hot days is calculated for each grid point. The indicator is the mean of the annual values for all grid points (areal mean). For more information about the calculation method refer to a report by the DWD (Müller-Westermeier 1995, in German only).

More detailed information: 'Trends der Lufttemperatur' and 'Gesundheitsrisiken durch Hitze' (in German only).