BO-I-1 + 2: Soil water in agriculturally used soils and in forest soils
2023 Monitoring Report on the German Strategy for Adaptation to Climate Change
2023 Monitoring Report on the German Strategy for Adaptation to Climate Change
The availability of soil water influences plant development in a fundamental way. In farmland cultivation both drought stress and waterlogging during critical development phases can adversely affect yields. The soil moisture modelled for selected arable crops during the growth period has diminished, indicating a significantly falling trend. The decline has been particularly conspicuous during the years since the turn of the millennium.
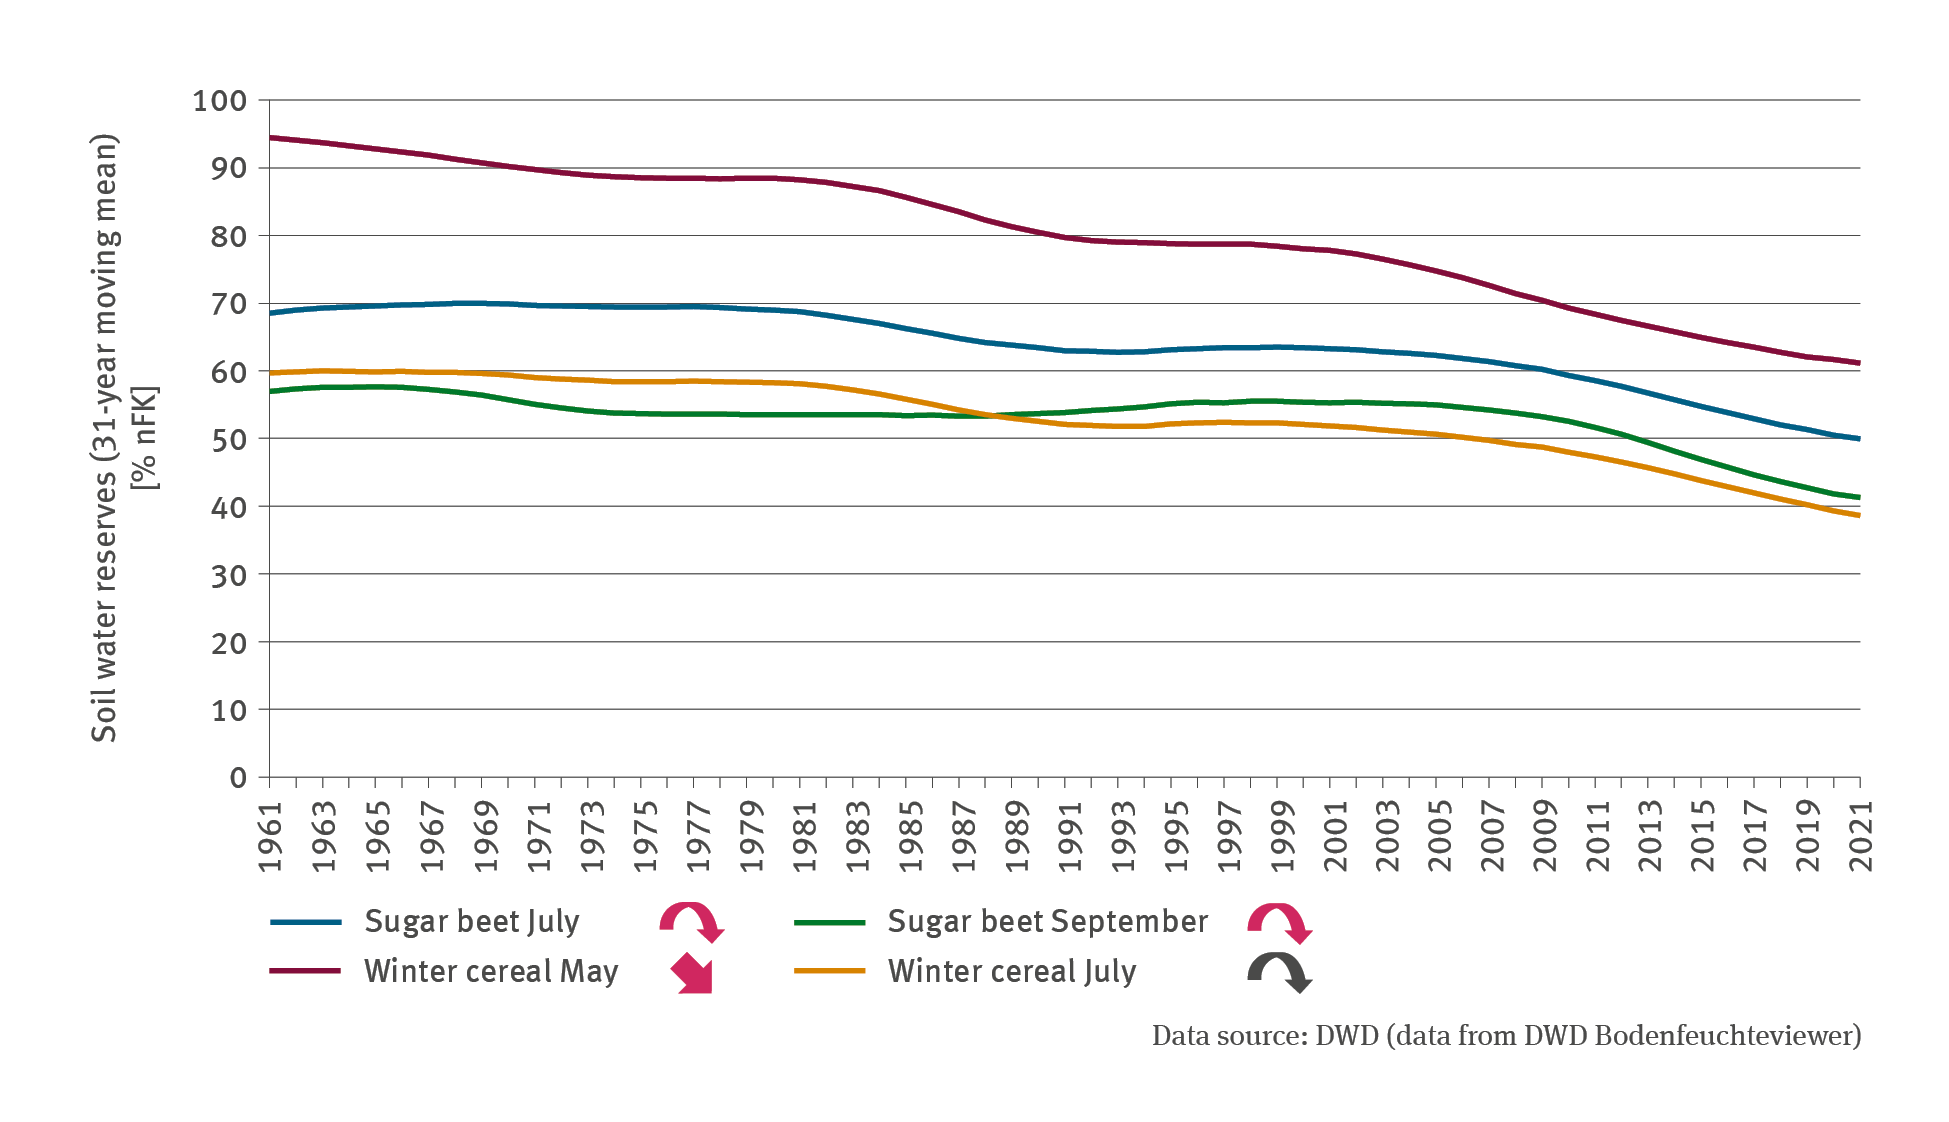
The illustration contains a line chart which indicates the development of soil water reserves in agriculturally used soils as a percentage of usable field capacity. The time series extends from 1961 to 2021. The illustrations show the relevant moving 31-year mean. Also shown is the development of soil water reserves under a winter cereal crop in May and in July, as well as under a sugar beet crop in July and September. The line for winter cereal in May indicates a significantly falling trend, whereas the other lines indicate trends with trend reversal towards a falling trend.
Measurements taken at climate stations in Bavarian forests demonstrate that years with precipitation deficits lead to persistent phases of drought stress. In 2018 extreme drought stress was measured for almost 40 years in terms of the five-year mean for stations distributed across Bavaria. During most of the growth period, the soils were undersupplied with water. In the precipitation-rich year of 2021, the situation eased.

The illustration contains a stacked columns chart indicating the number of days with drought stress. The time series extends from 2000 to 2021. There are no data available for the years of 2001 or 2005. The illustration shows the relevant number of days with a usable field capacity of less than 40 per cent as well as the number of days with a usable field capacity of less than 20 per cent. So far, days with a usable field capacity of less than 20 per cent occurred in eight years. In 2018 the number amounted to 39 days which is distinctly more than in each of the other years. So far, days with a usable field capacity of less than 40 per cent occurred in every year. The values fluctuated between roughly 6 days in 2000, and 154 days in 2018. Neither of the two categories indicate a trend.
Precipitation and temperature are important factors in the process of soil formation; they have direct influence on both the water balance and mineral balance of the soil. If precipitation scenarios change as a function of climate change, this will have consequences for soils, no matter whether soils are used for agricultural or forestry purposes, or whether urban soils or soils with near-natural vegetation are concerned. It is expected that, depending on soil properties, different amounts of seepage are likely to diminish in summer owing to greater evaporation, whereas they are expected to increase in winter owing to additional precipitation. On one hand, this development impacts groundwater replenishment (cf. Indicator WW-I-2). On the other, the actual amount of seepage governs the removal of minerals such as nitrate from the soil. High precipitation levels in winter, especially when the precipitation falls on agricultural land with sparse vegetation cover, can result in repeated leaching of minerals. If soils dry up more strongly in the summer months, their water conductivity diminishes. This process also diminishes the infiltration speed. Increased surface discharge consequently leads to the loss of water from the landscape at the same time as increasing the risks of flash floods and erosion (cf. Indicator BO-I-3). Furthermore, dry soils and dry vegetation increase the hazard of vegetation fires. In cases where there is a lot of dry litter in a forest, a fire can start even in a scenario – meteorologically speaking – of a medium forest fire hazard (cf. Indicator FW-I-8).
The soil moisture is stated in the indicator as a percentage of usable field capacity (nFK). This variable identifies the water reserves in a soil which are available for use by plants. Where soil moisture drops below a value of 50 % nFK owing to low precipitation and high evaporation levels, drought stress is bound to arise affecting numerous plant species in these circumstances. Where soil water reserves drop below 40 % nFK, this situation is assumed to be a medium to high drought stress hazard, whilst below 20 % this is assumed to be a very high to extremely high drought stress hazard. Values in excess of 100 % nFK will occur in cases when there is more water in the soil than it can hold. This surplus water can subsequently seep away, run off laterally or evaporate.
For the development of agricultural crops, the availability of water in the soil is a highly relevant, influential variable. When in the spring and summer months, periods of high temperature and low precipitation coincide with increased water demand by vegetation, it can occur that the soil water available to plants is soon exhausted. For annual crops (in particular cereal species) that develop their flowers mostly in the months of April till June when they grow fastest, drought stress in this phase is particularly critical. In respect of crops such as sugar beet, which remain in the field for longer periods, lack of soil humidity usually has adverse effects even as late as September. Sugar beet – as indeed other root vegetables – is able to increase in biomass until shortly before harvest, provided the crop can draw on ample water supplies. By contrast, a poor water supply in July is less serious in respect of cereal crops, as this is the time when cereal ripens. Excessively high soil moisture in thisphase might even have adverse effects on yields, partly because excessively high-water contents might limit the use of vehicles on cultivated ground, thus making timely harvesting impossible. The DWD uses models of soil moisture in
respect of agricultural crops on the basis of a 1 km x 1 km grid, taking into account the soil information from the Soil Overview Map (BÜK) 1000. This is done on the basis of interpolated meteorological data and the observed development status of the plants, prevailing at the time. Given the regional differences in soil properties and precipitation scenarios, nationwide observations of mean values should be interpreted with caution. Nevertheless, it is possible to discern longer-term development trends. The time series so far demonstrates that the models indicate – both for wheat and sugar beet – significantly diminishing availability of water during the growth period97. The measuring data from intensive monitoring in the forest, in this case from a case study at Bavarian Forest climate stations, do not indicate a trend. The massive drought stress which in 2018 prevailed also in Bavarian forests, entailed severe forest damage (cf. Indicator FW-I-3). In agriculture, it is possible to respond to drought by means of cultivating drought-tolerant species and varieties (cf. Indicator LW-R-2), by adapted (for instance ploughless) soil tillage or by irrigation (cf. Indicator LW-R-6) In forestry, by comparison, the composition of tree species is the most important lever.
The UBA’s motto, For our environment (“Für Mensch und Umwelt”), sums up our mission pretty well, we feel. In this video we give an insight into our work.