Cities are often subject to climatic conditions which are very different from the climate prevailing in their periphery. For example, the relative air humidity tends to be lower, and the mean temperatures tend to be higher. In respect of temperature differences between urban and rural areas, climatologists refer to ‘urban heat islands’. The intensity of the urban heat island effect is largely dependent on the size of a town or city, its density of buildings, their height, degree of insulation, the proportion of green space and the construction materials used. Also cloud cover and wind patterns play important roles in terms of urban heat stress.
In hot summer months this can entail health problems for the population in cases where – owing to their characteristics – urban spaces heat up considerably during daytime without cooling down over night to the same extent as it happens in their rural periphery (cf. Indicator GE-I-1). This type of situation may occur more frequently in future. As indicated by climate projections for Central Europe, mean temperatures will rise and the overall weather characteristics will change too. For example, extreme thermal values are expected to occur more frequently. For instance, the frequency of so-called ‘hot days’ is expected to increase, with maximum air temperatures reaching or exceeding 30 °C. Besides, the population will experience stress on so-called ‘tropical nights’ when the thermometer will not go below 20 °C and there is little chance of enjoying a restful night.
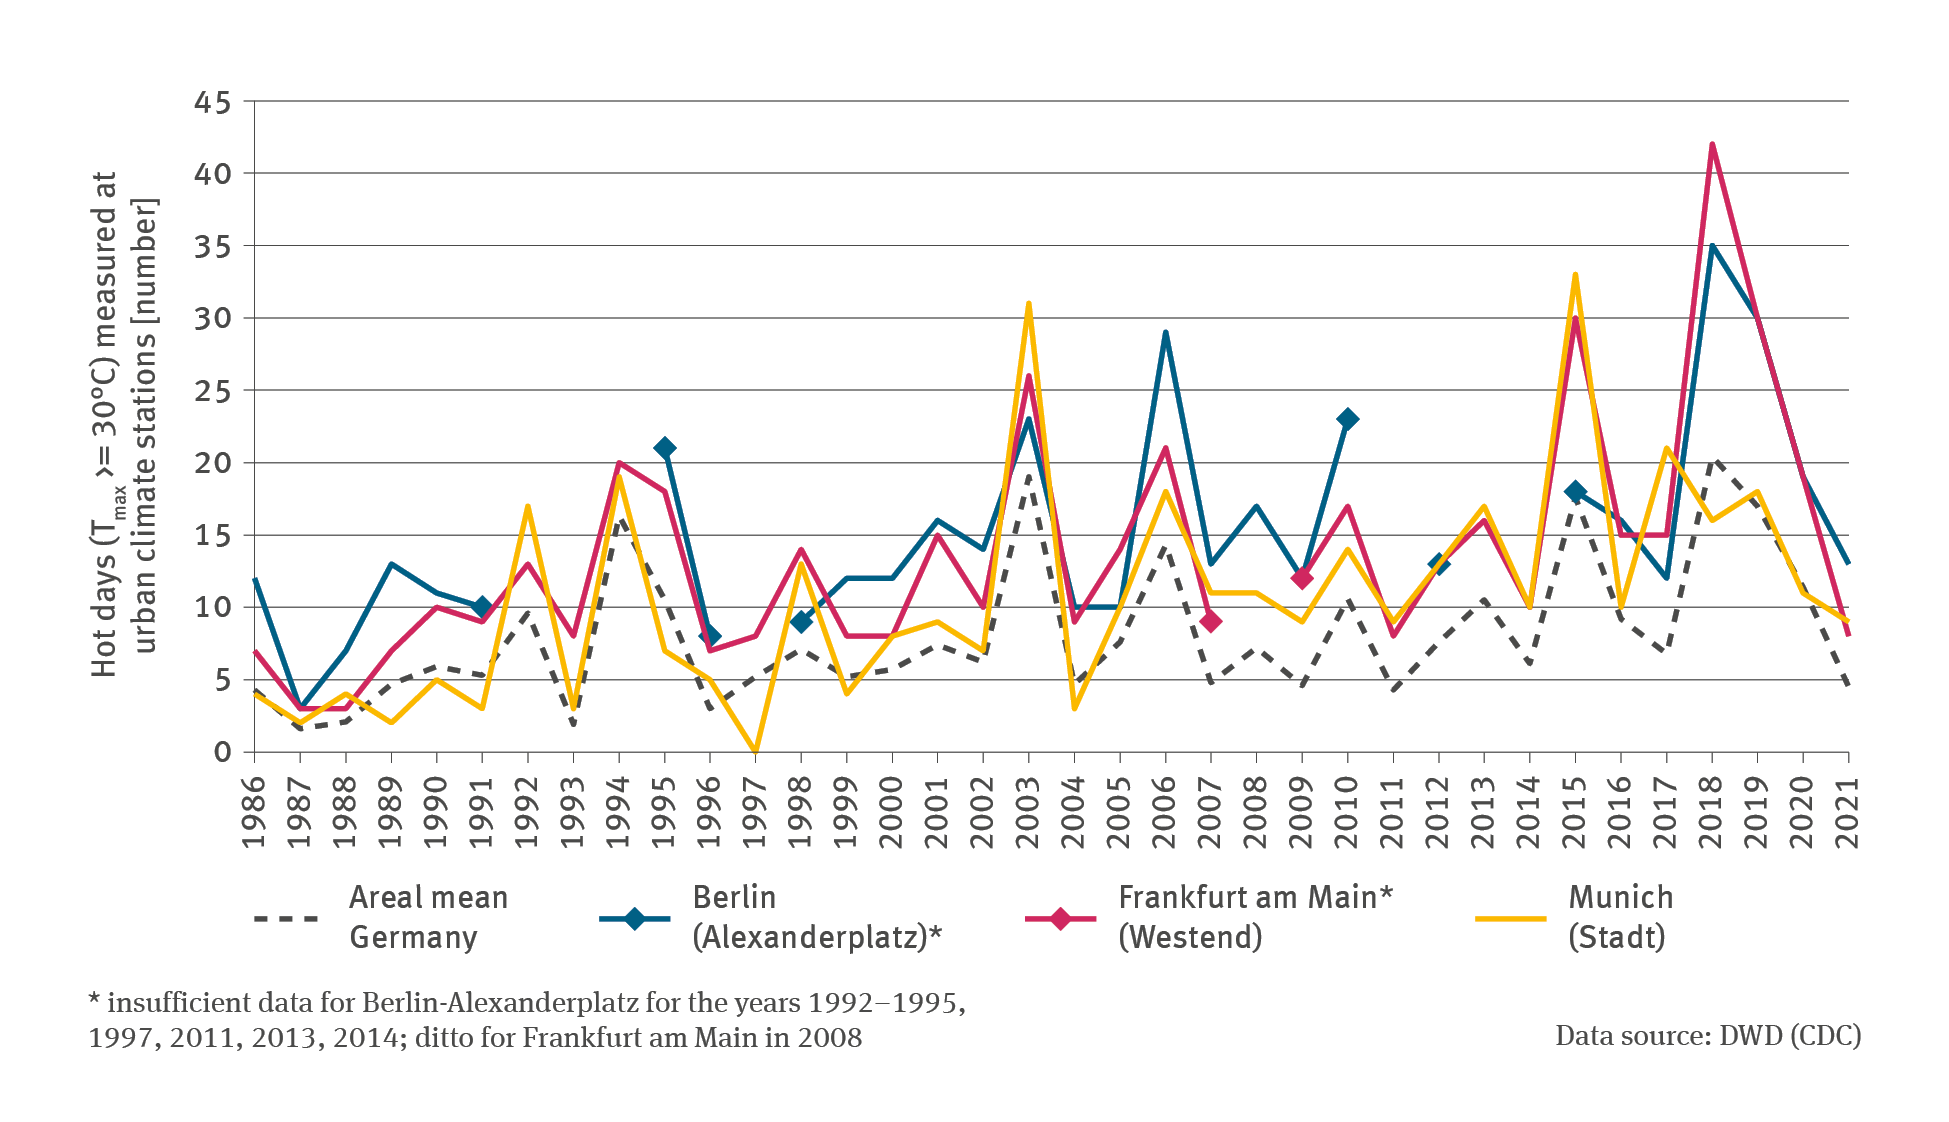
As far as Germany’s surface area mean is concerned, the mean number of hot days has increased from approximately three days per annum in the 1950s to currently approximately 10 days per annum. The time series from urban climate stations in Berlin, Frankfurt am Main and Munich were ascertained on the basis of daily maximum air temperatures as recorded in the course of daily observations at those stations, and for tropical nights on the basis of daily minimum temperatures. These records do not go back as far as 1951. It is therefore not possible to make a direct comparison with the development at a nationwide level over that period. However, there is evidence from shorter time series that cities are exposed to special circumstances. Here, hot days – albeit with regional differences – clearly occur more frequently in most years than compared to the nationwide mean. In years with above-average hot summers, such as 2003, 2015 and 2018, the differences are particularly distinct. In 2018 the hitherto highest nationwide mean in Frankfurt am Main was exceeded more than twice, with a record of 42 hot days. This is to some extent due to the fact that increasingly, hot days in towns and cities occur even beyond the meteorological summer months (June until August). In other words, it has been noted that in Berlin and Frankfurt am Main, hot days have been observed more and more frequently as early as May and as late as September. As against hot days, the difference is even more striking in a comparison of tropical nights – not illustrated here – in cities with the areal mean for Germany. While Germany’s nationwide mean was between 1 and 1.5 tropical nights for the years mentioned, in Frankfurt am Main, as many as 13 and in Berlin as many as 20 such nights were recorded.
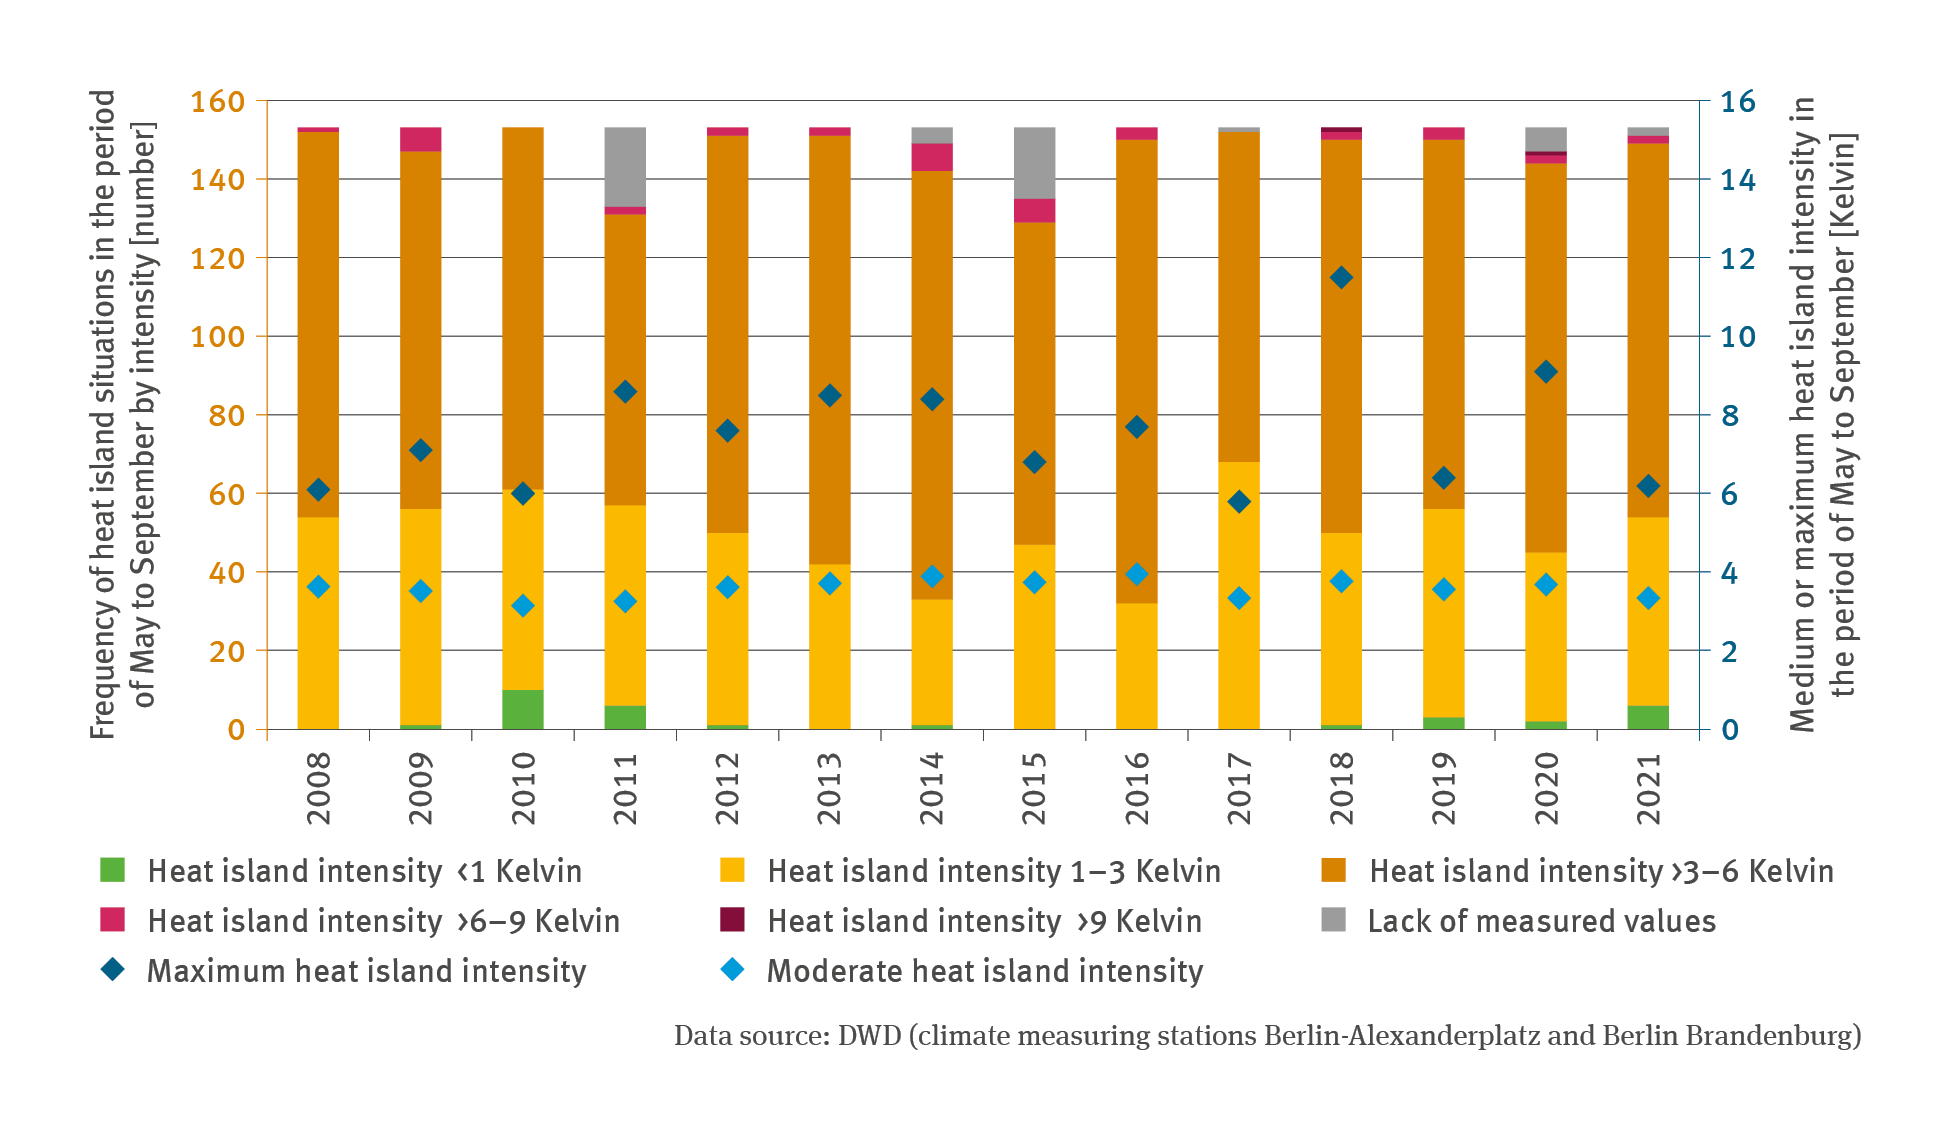
In contrast with hot days and tropical nights, the time series for urban heat island effects – on the basis of values measured every 10 minutes for the city of Berlin – does not refer to the frequency of times when the threshold value was exceeded. In fact, it refers to the maximum daily temperature differential between the centre and the city’s immediate periphery. In the summer months of June to August, these values are on average between 3 and 4 Kelvin. However, on peak days, temperature differences of almost 11 Kelvin, as for instance in 2018, are possible. Overall, high temperature differences occur especially in the evenings and at night. In other words, the inner city cools down distinctly more slowly and to a lesser degree than the periphery. This means that it is often too hot for the city population to get a sufficiently restful night.
So far the time series does not make it possible to judge whether climate change exacerbates the urban heat island effect. This may be because heat stress is increasing with equal strength in both cities and their periphery. This is roughly confirmed by indications contained in projections for Frankfurt am Main135. Even without an increase in the intensity of urban heat islands, this would mean for the future that stressful situations will in all likelihood continue to be most frequent wherever the heat stress is already high at present. Provided the temperature gradient between town / city and periphery does not change, it is furthermore to be expected that rising temperatures will mean that an ever-increasing part of the urban area and thus its inhabitants will be affected by heat stresses.
135 - Früh B., Koßmann M., Roos M. 2011: Frankfurt am Main im Klimawandel. Eine Untersuchung zur städtischen Wärmebelastung. Berichte des Deutschen Wetterdienstes, Band 237. Dt. Wetterdienst. Offenbach am Main, 68 pp. https://www.dwd.de/DE/leistungen/pbfb_verlag_berichte/pdf_einzelbaende/237_pdf.pdf