The highest number of hot days averaged across Germany were recorded in 2003, 2015, 2018 and 2022.Despite considerable fluctuations between individual years, the overall trend is rising significantly.More hot days are expected during summer months in the coming decades due to climate change. read more
climate change
Umwelt-Indikator
Indicator: Global surface temperature
2024 was the warmest year worldwide since records began 1850.The last ten years have been the warmest years worldwide since 1850.The Paris Agreement stipulates that the increase in global temperature should be limited to well below 2 °C above pre-industrial levels, and even to 1.5 °C. Due to historical data availability, the comparative period used by WMO for this purpose is 1850 to 1900. read more
Indicator: Share of renewables in gross electricity consumption
The share of renewable energies in gross electricity consumption rose from 6.3 % to 54.4 % between 2000 and 2024.The German Renewable Energy Sources Act (EEG) stipulates that the share of renewable energies should increase to at least 80 % by 2030.If Germany fulfills its ambitious expansion targets for new photovoltaic and wind power plants over the next few years, this goal is within reach. read more
Indicator: Share of renewables in gross final energy consumption
Gross final energy consumption includes all types of final energy consumption by end consumers, including electricity, district heating, fuels and fuels for heat generation.As part of the updated EU Renewable Energy Directive (RED) targets, the German target has been set at 41 % by 2030.Achieving this target will require new measures and a significant acceleration in the expansion of renewable ene... read more
Soil | Land
Soil loss by wind erosion
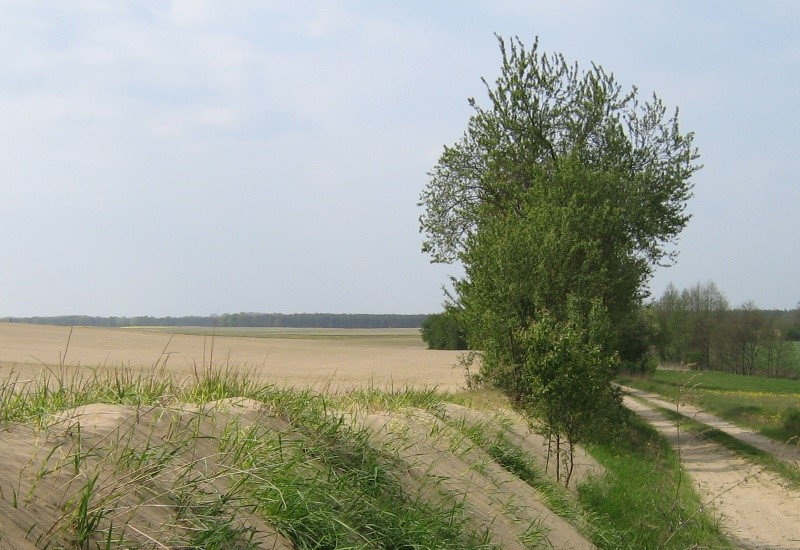
When strong winds hit bare or only poorly covered soil, soil material is stirred up and transported, sometimes over long distances, through the open landscape. The result is the stealthy loss of fertile soil. Neighboring sites and ecosystems can be affected. Also, for people dangerous situations are possible, for example due to impaired visibility. read more
Climate | Energy
The 1.5°C goal of the Paris Agreement
What do people mean when they talk about the “1.5°C goal” in the context of climate change? What is the origin of this value and how is it quantified? What happens if we exceed it – is there any way back down below a global warming of 1.5°C? In this text, we look at the emergence of the 1.5°C goal of the Paris Agreement and explain why we need to keep it within reach. read more
News on Sustainability | Strategies | International matters
CASRI Project Tackles Environmental and Sustainability Challenges
In April 2024, the EU-funded CASRI project (Collaborative Action for Systemic, Actionable, and Transversal Sustainability Research and Innovation) was officially launched at the German Environment Agency (UBA) in Dessau. read more
News on Climate | Energy
UBA & IIASA cooperate on modelling climate action scenarios
As part of an in-house research project, UBA is working on the use and further development of an integrated assessment model (IAM) developed by the independent research institute IIASA. IAMs combine economic, social and ecological aspects for the development of climate action scenarios and are central to the IPCC process. The cooperation between UBA and IIASA is now official. read more


