Nitrogen dioxide loads in Germany down slightly in 2018
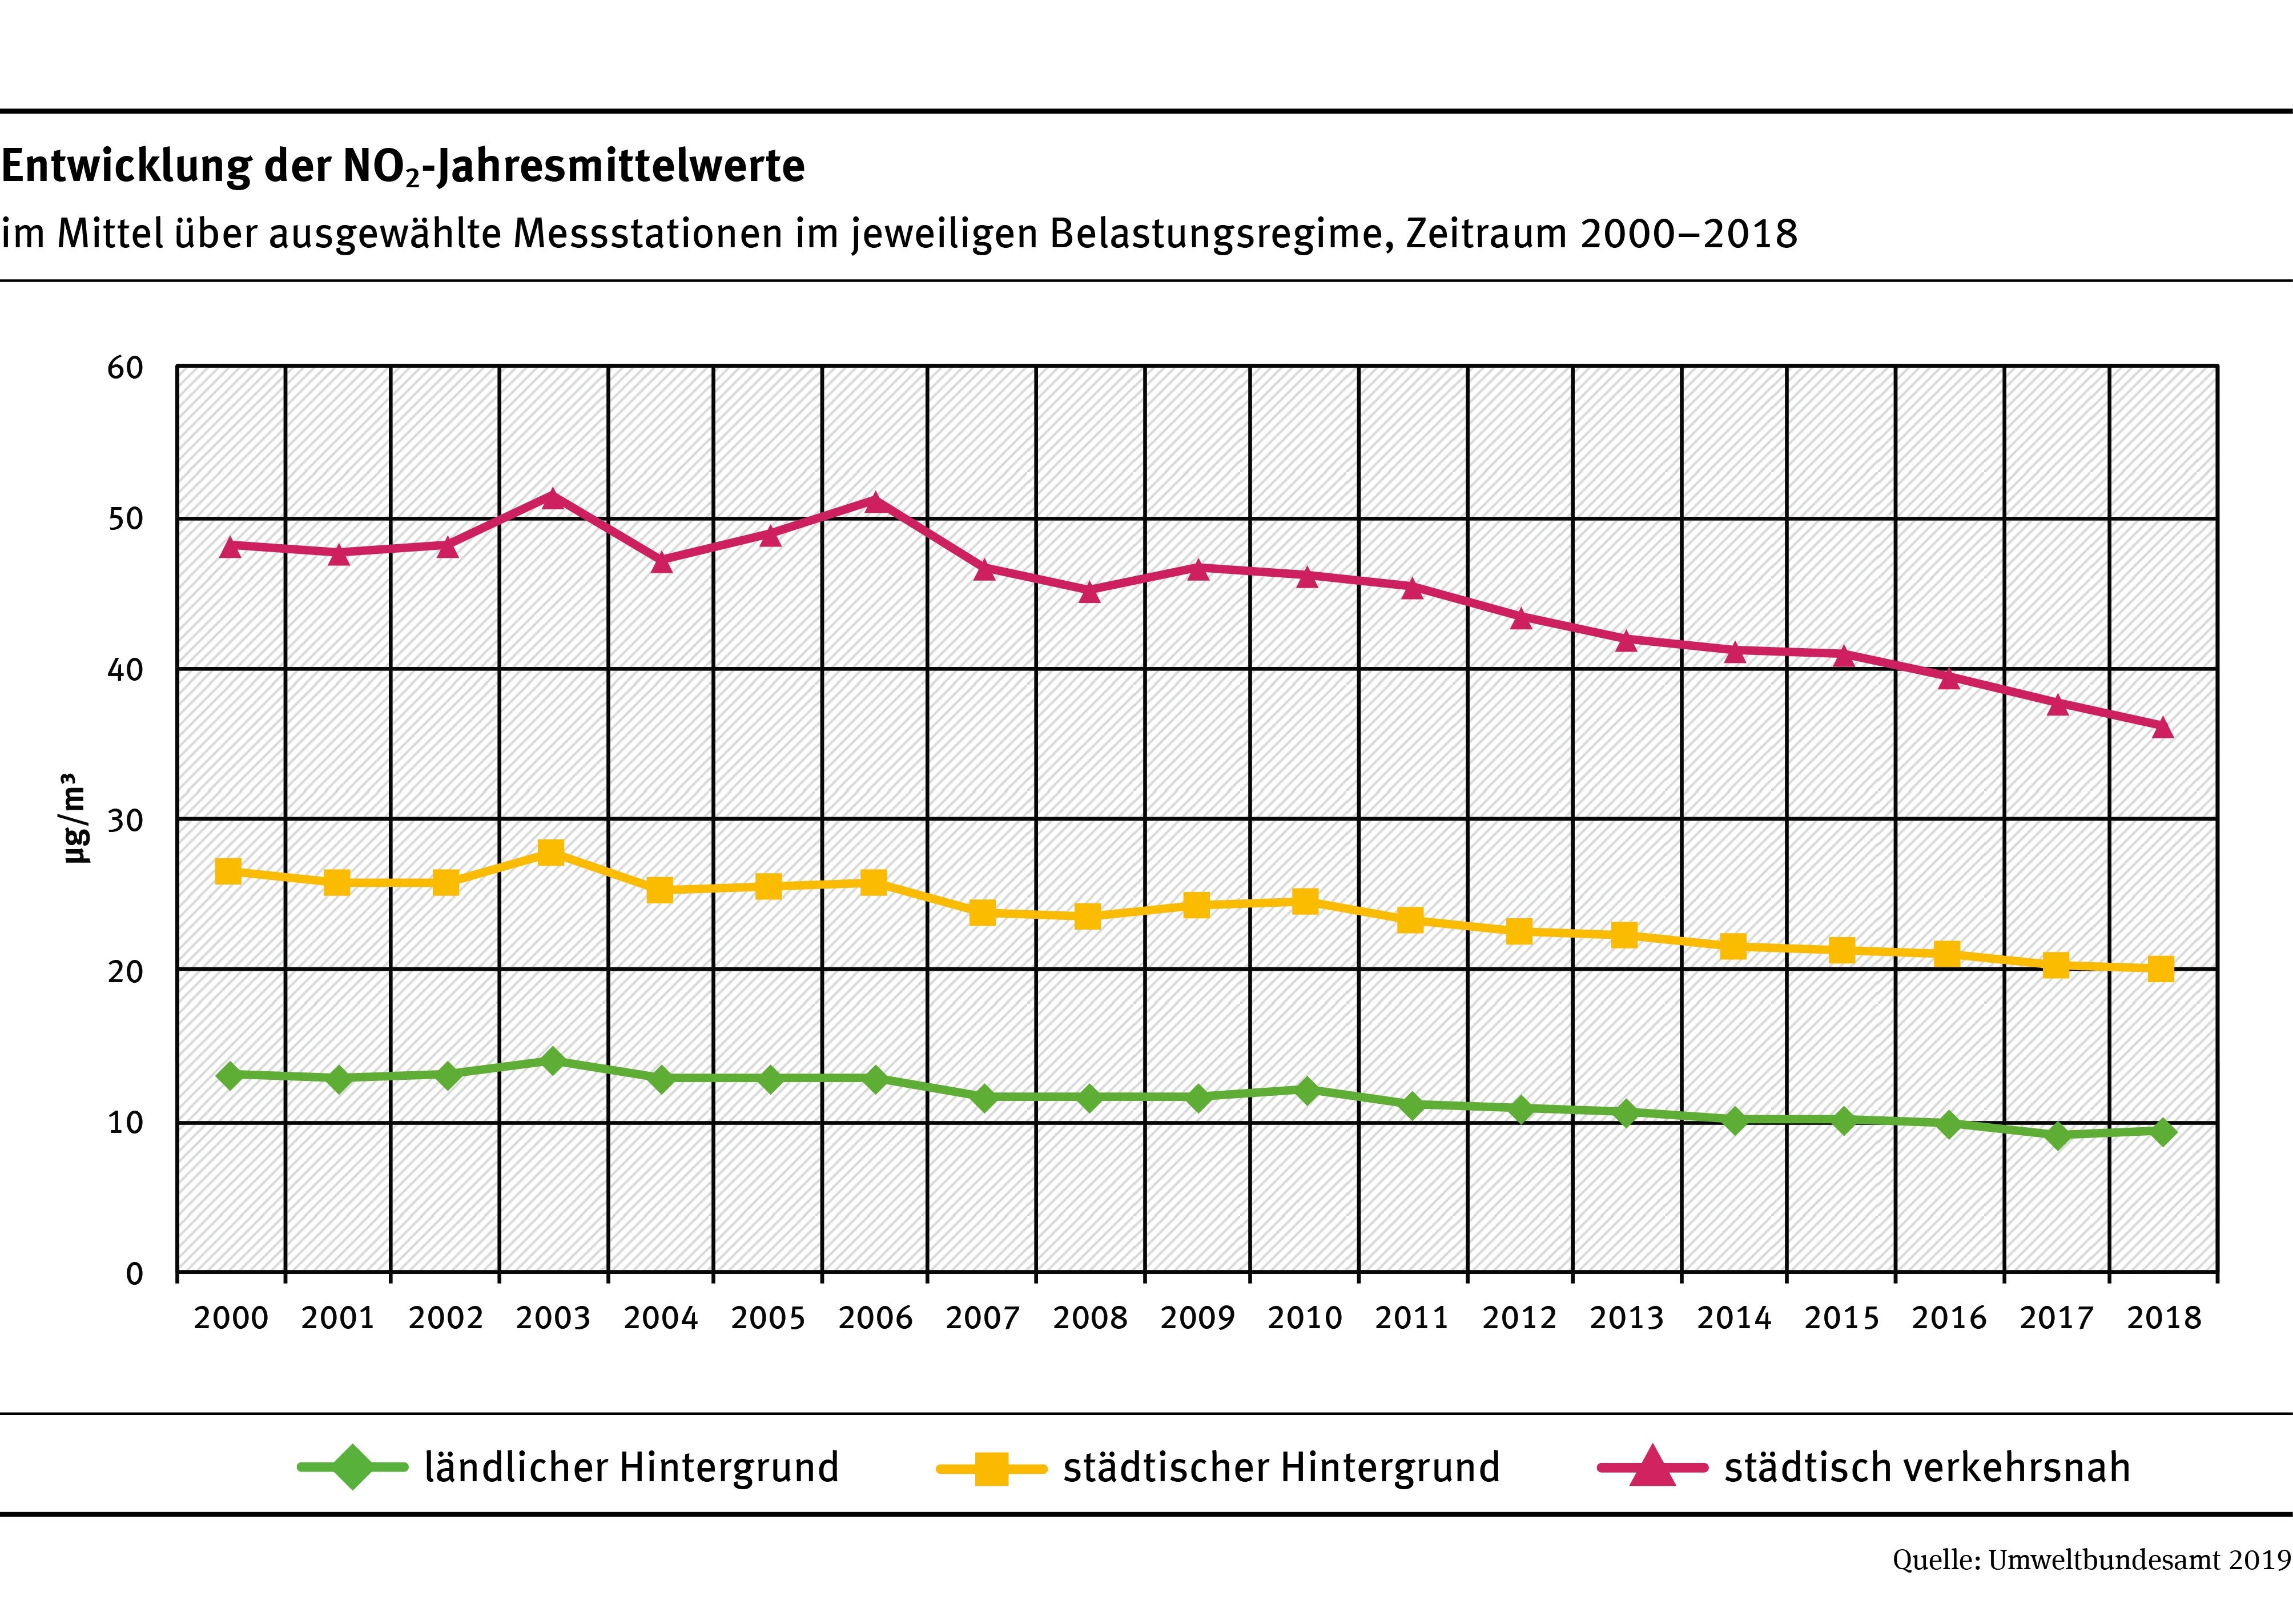
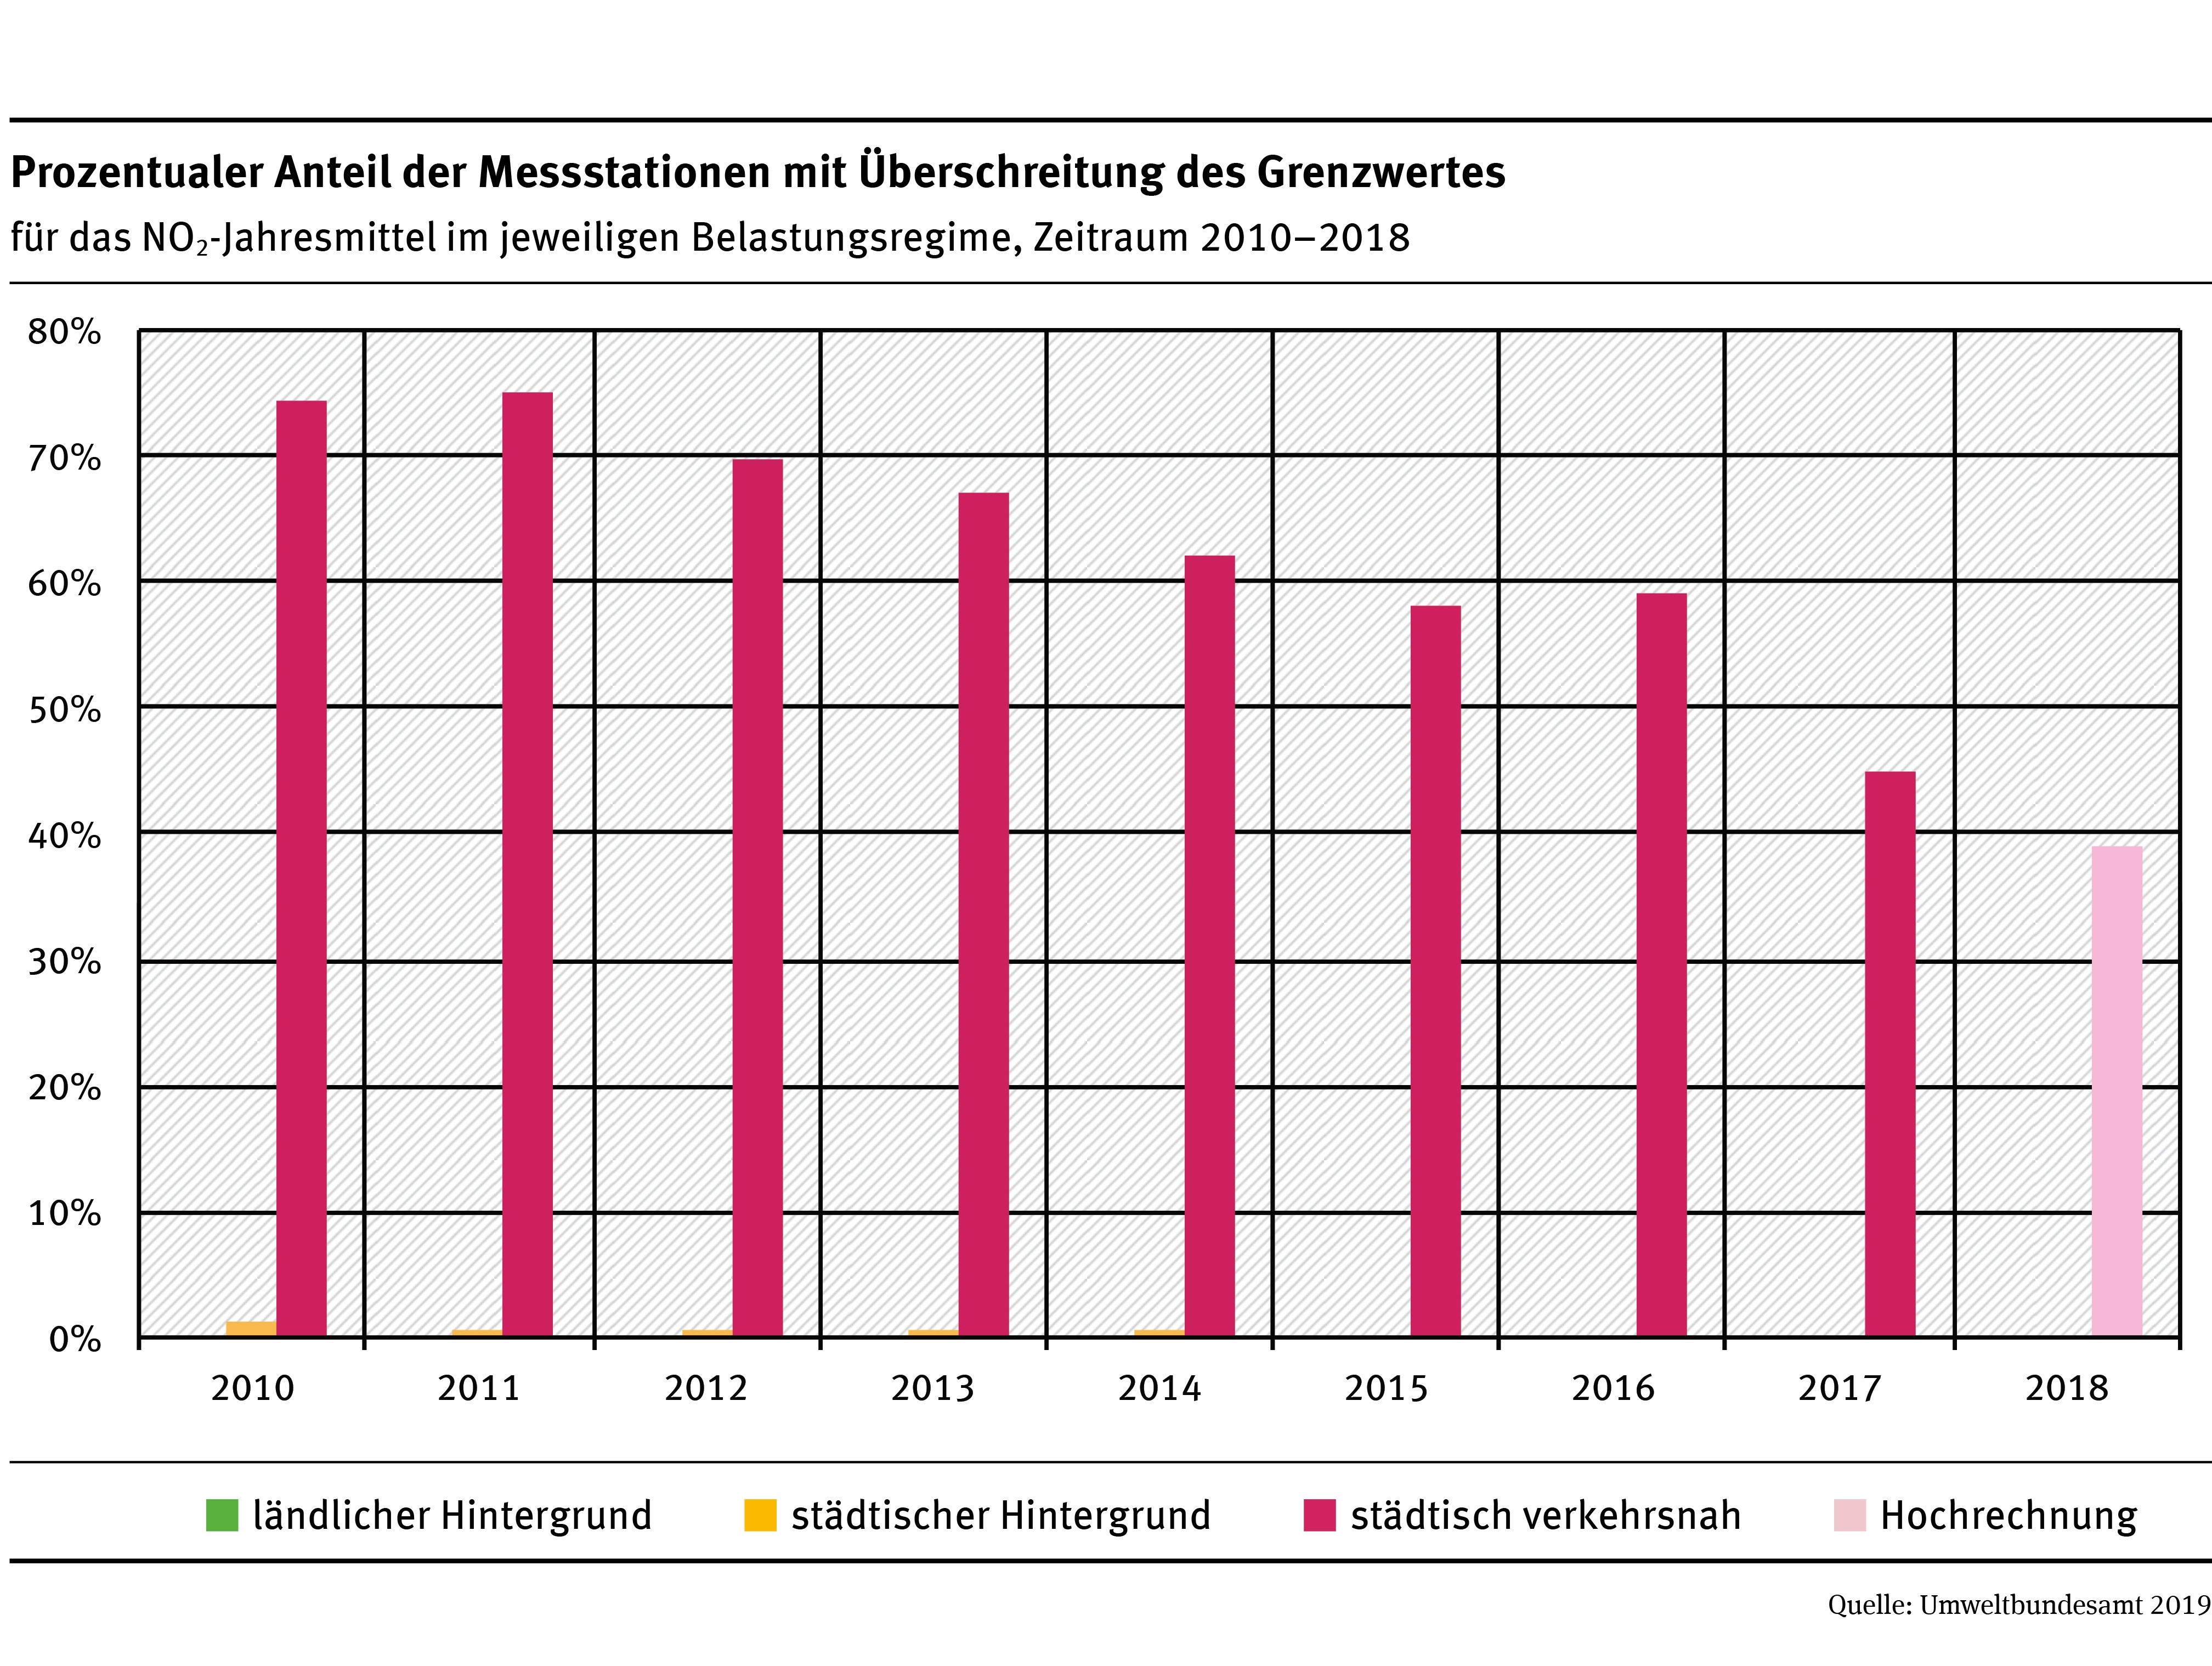
Nitrogen dioxide loads in Germany are declining slightly. According to preliminary data, however, the limit value of 40 µg/m³ for NO2 was exceeded in a number of cities throughout Germany. Such exceedances are projected to have occurred at about 39 percent (2017: 45 percent) of traffic-oriented measuring stations. Average nitrogen dioxide pollution throughout Germany is down slightly, by about two micrograms, compared to the previous year. These are the results of the preliminary evaluations of data from the Länder and the German Environment Agency (UBA). Evaluations can only take account of the 399 measuring stations whose data is reported automatically to the authorities. The evaluation of data from another 132 stations is still outstanding, with results expected in May 2019. Only then will it be possible to issue an accurate statement about how many cities are in compliance with the threshold value for NO2.
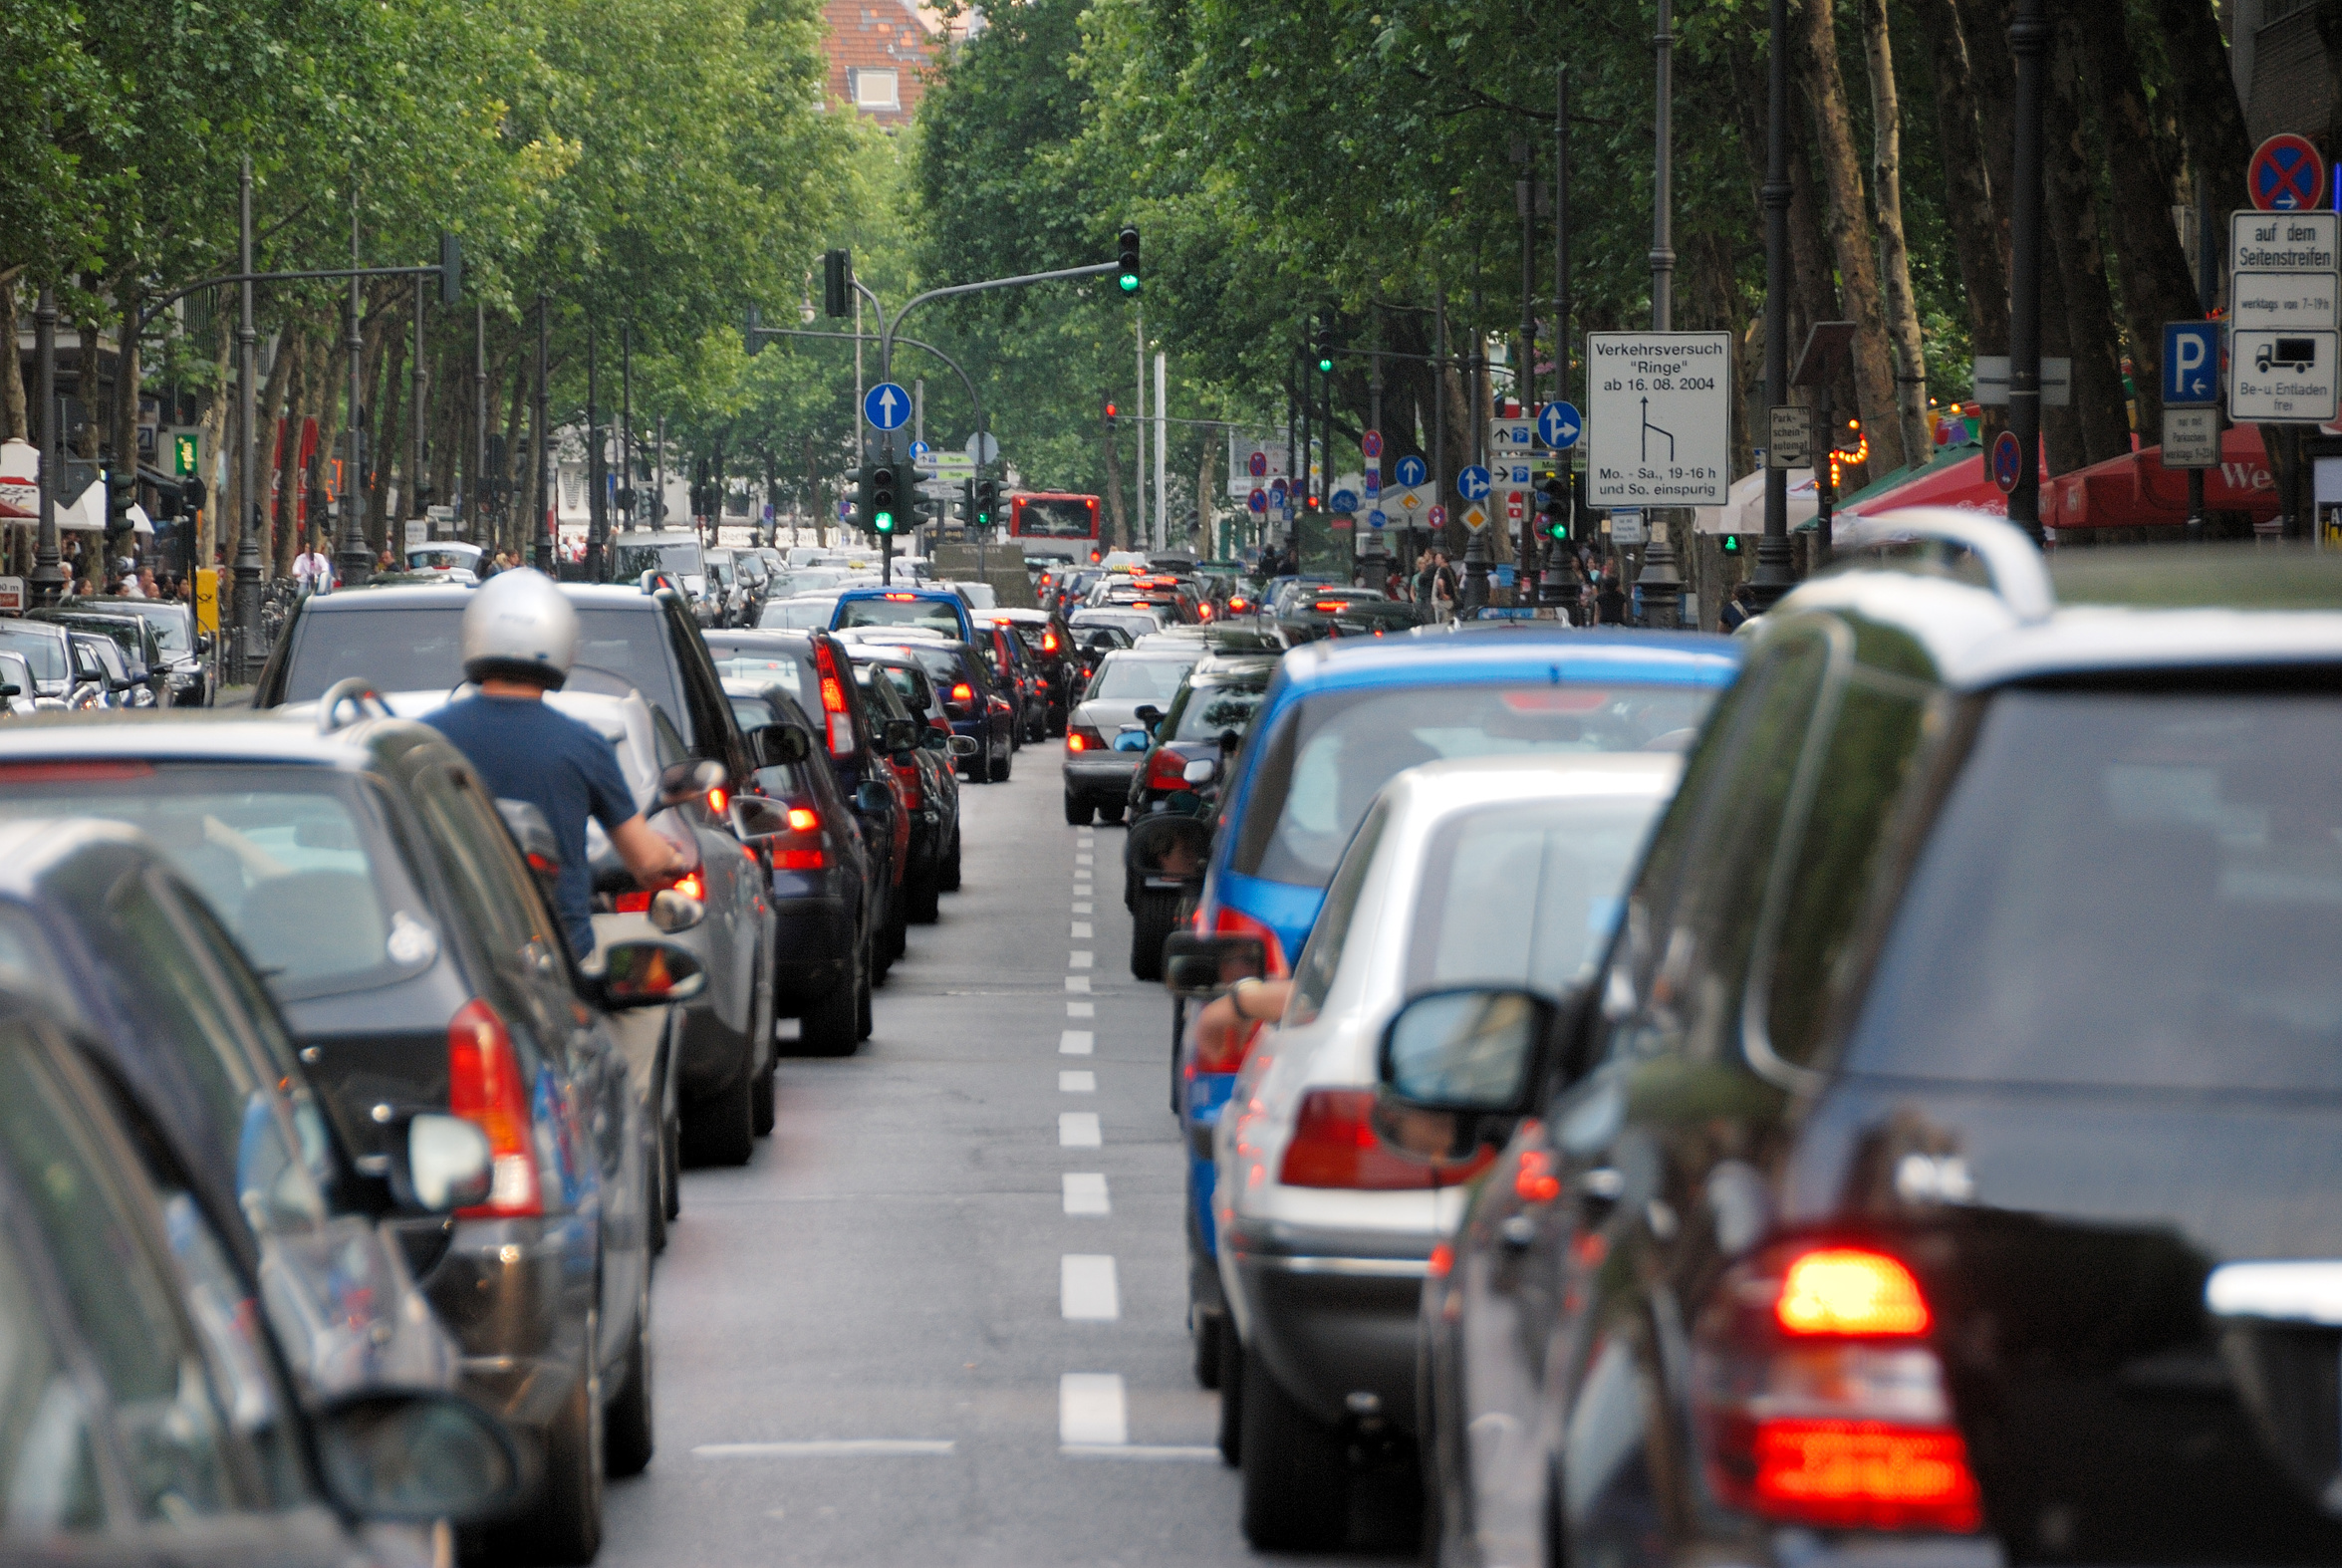
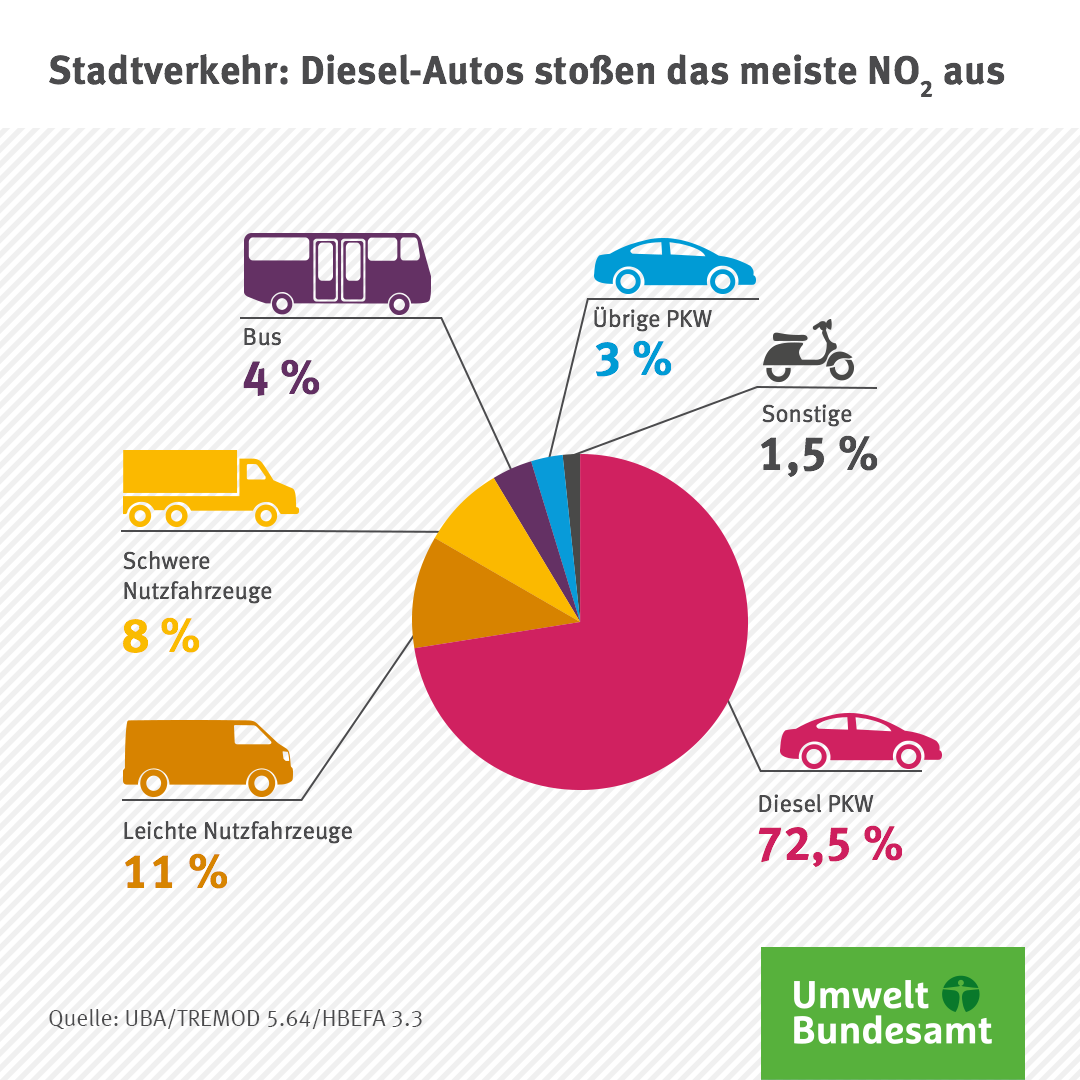
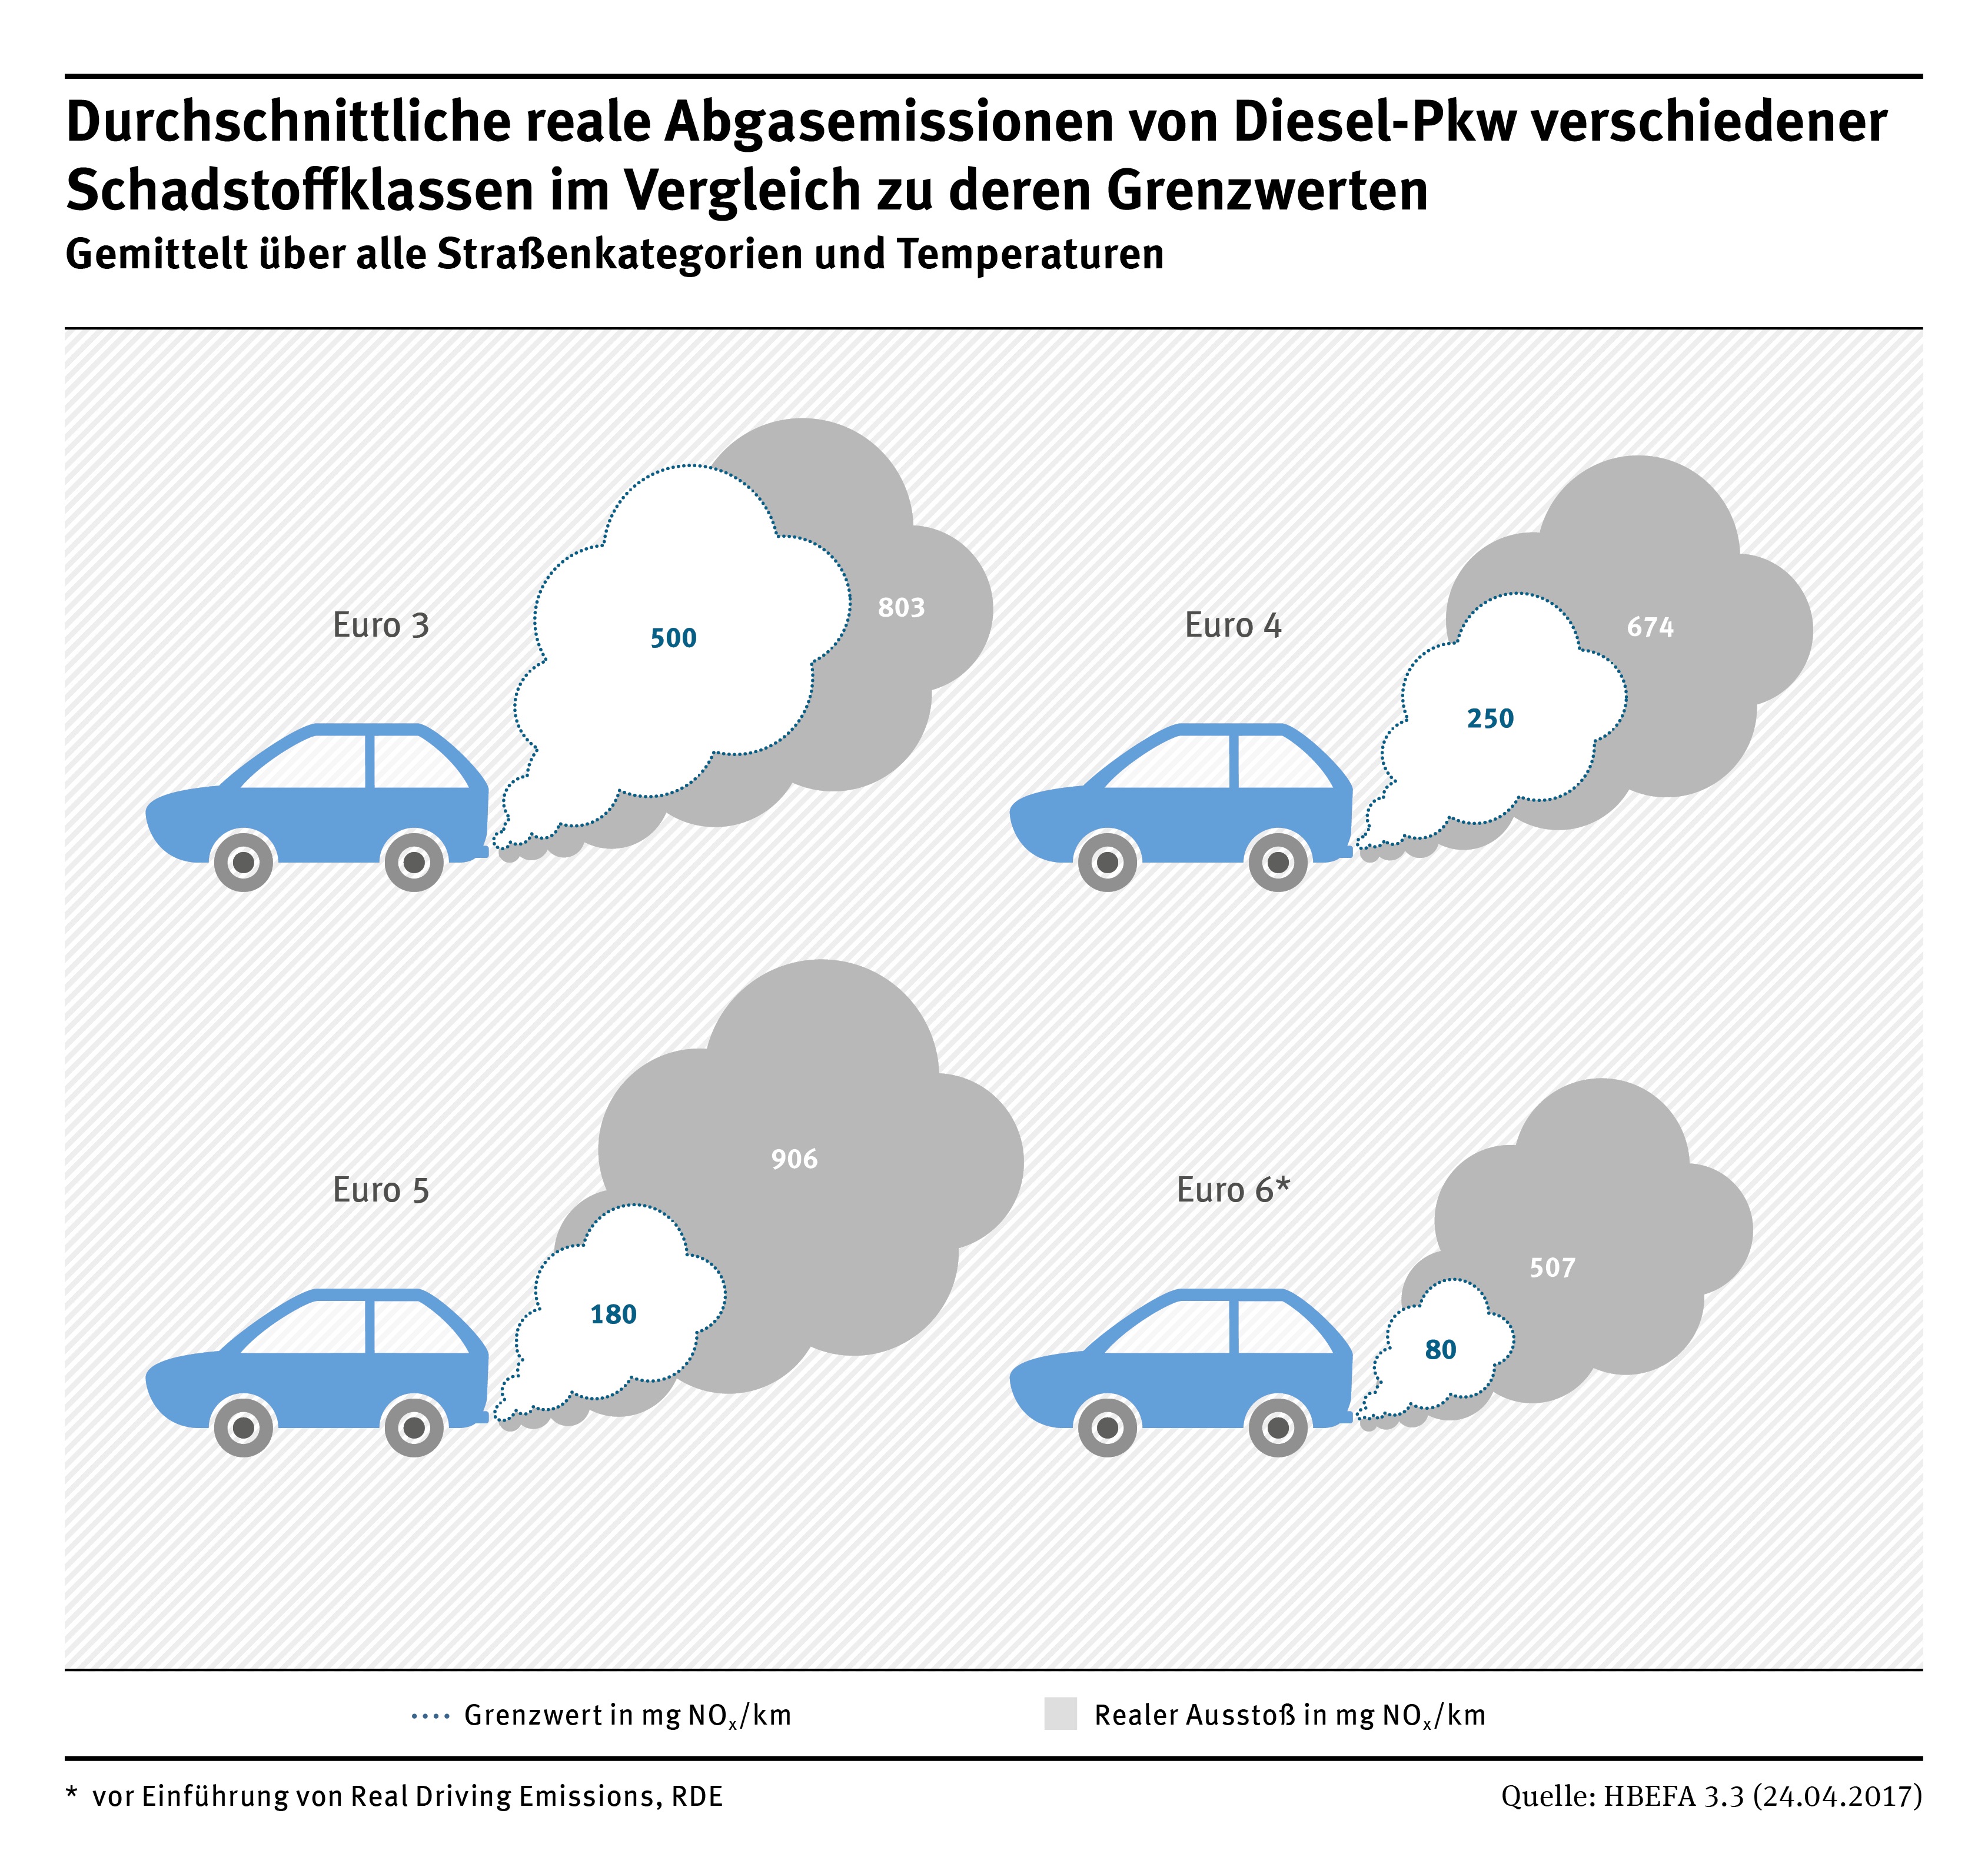
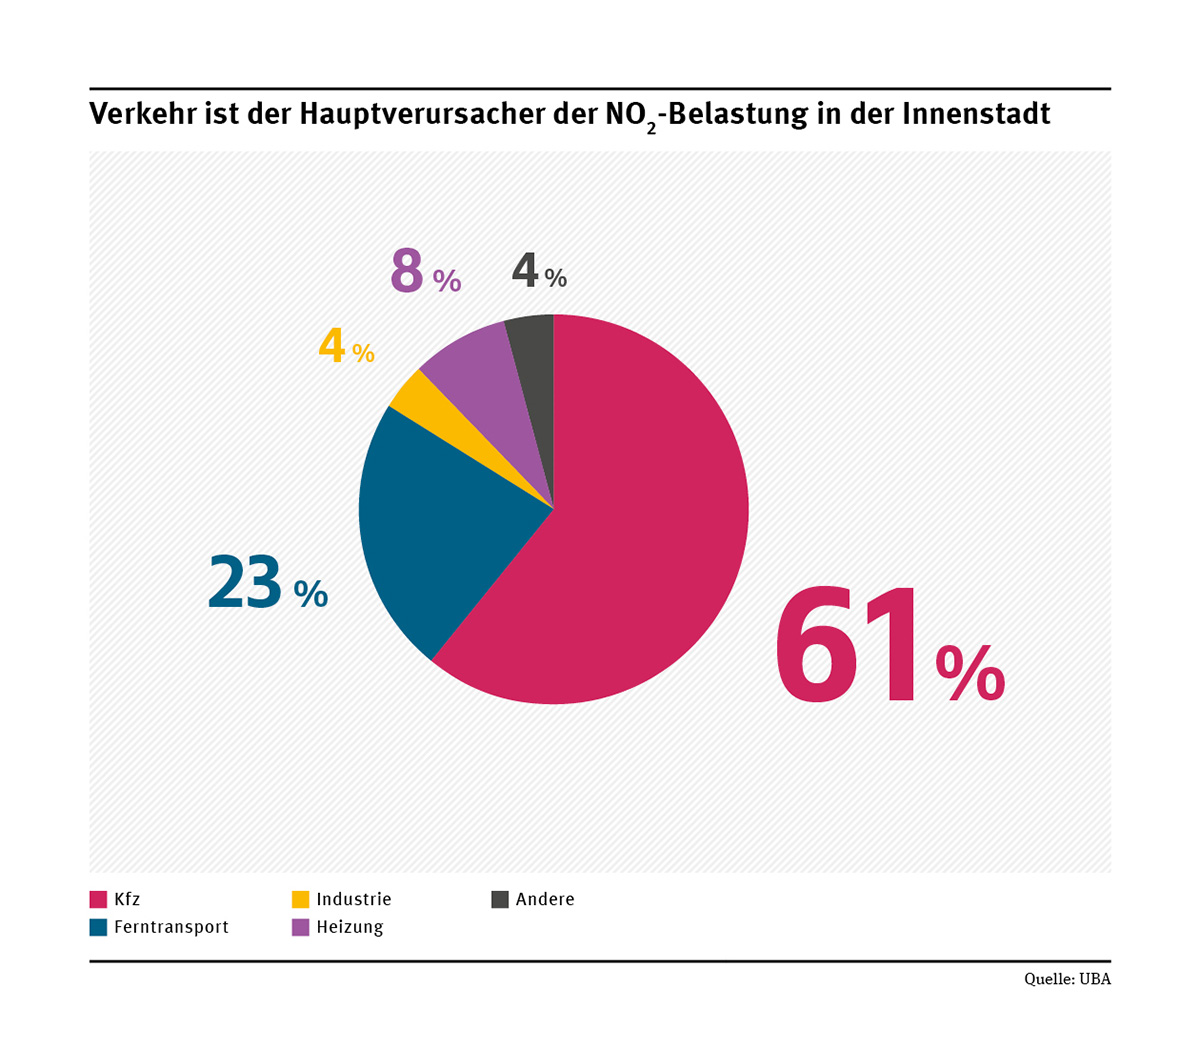
Maria Krautzberger, President of UBA, said: "The threshold value in effect since 2010 is still being exceeded in many of Germany's cities, putting the health of their residents at risk. Road traffic is the main culprit and diesel cars with excessively high emissions in particular. This is where real efforts must be made: these vehicles must be retrofitted with efficient catalytic converters – and at the polluter’s cost, namely the automotive industry. Only clean cars can assure the prevention of looming driving bans. Both the technology and the legal framework for retrofitting are in place and must now be implemented quickly. The measures currently in place will simply take too long to ensure clean air everywhere."
The decline in mean NO2 concentrations of roughly two micrograms at traffic-oriented measuring stations is due to a number of factors: local measures such as speed limits or traffic restrictions, regional or national measures such as the renewal of the vehicle fleet by means of cash for trade-ins or software updates, or meteorological conditions which either accelerate or slow down the spread of pollutants. Measuring data cannot in and of itself tell what or how much an individual measure contributes to achieving reductions. This is because the above factors as a whole have an impact on measurement results. Detailed calculations would enable determination of the effect of individual measures; however, such calculations based on individual measuring stations are not available.
The measuring stations are set up by the federal states (Länder) according to uniform European regulations. Ms Krautzberger said: "Germany is in compliance with the regulations the EU Member States have established. The European Air Quality Directive was transposed one-to-one into German law. That is our only benchmark – not whether other states may or may not be complying with jointly agreed regulations."
- A table with the highest recorded levels in 2017 compared to 2018 is available here.
- A complete list of measuring stations and NO2 values of 2015-2018 is available here.
- An overview of the cities which exceeded the limit values in 2017, and levels in 2018, is available here.
Particulates (PM10): 2018 was the first time there were no exceedances of the prescribed limit value for particulates in effect since 2005. Only one measuring station in an industrial area in North Rhine-Westphalia recorded particulate concentrations of over 50 µg/m³ on 36 days, where the permissible number of days is 35.
Ozone: Ozone concentrations in 2018 rose to higher levels than the previous year, thus exceeding the long-term objective for the protection of human health (not to exceed 120 µg/m³ as an 8-hour average) in the record heat summer at all 265 stations, on an average of 37 days per station. The frequency of the exceedance is unusually high and, starting from 2000, has only been outdone by conditions in summer 2003 (average of 50 days). The especially problematic aspect with regard to health is that ozone concentrations were consistently high and widespread from mid-July to mid-August 2018. The health effects of ozone include impaired lung function, inflammation and disorders of the respiratory tract. According to the WHO, the 8-hour average should not exceed 100 µg/m³, and a recent paper has recommended a reevaluation of the value for ozone. Ms Krautzberger said: “Ozone is formed when oxygen reacts with other molecules, in particular with nitrogen oxides and volatile organic compounds, e.g. from paints, varnishes and cleaning agents. This is why we must make every effort to further reduce the emissions of these ozone precursors.”


