Final data on nitrogen dioxide pollution 2020: downward trend continues
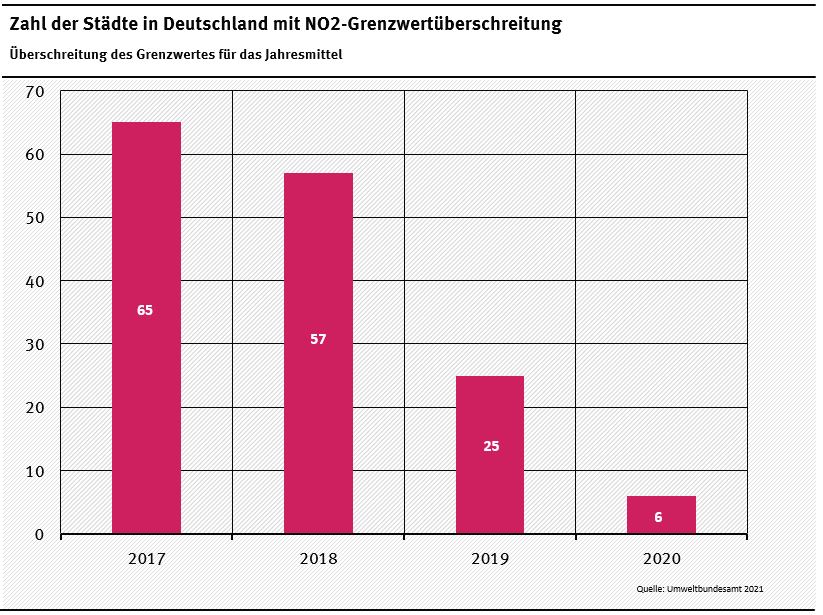
The 2020 data for nitrogen dioxide (NO₂) are available for all air monitoring stations in Germany. Six cities exceeded the air quality limit of 40 micrograms NO₂ per cubic metre of air (µg/m³) as an annual average. There were 25 cities still exceeding the limit in 2019 and 57 in 2018. Dirk Messner, President of the German Environment Agency (UBA) said, "The air in cities is getting cleaner, things are moving in the right direction and that is encouraging. However, there should have been compliance with the limit value for the protection of health, which was already decided in 1999, since 2010."
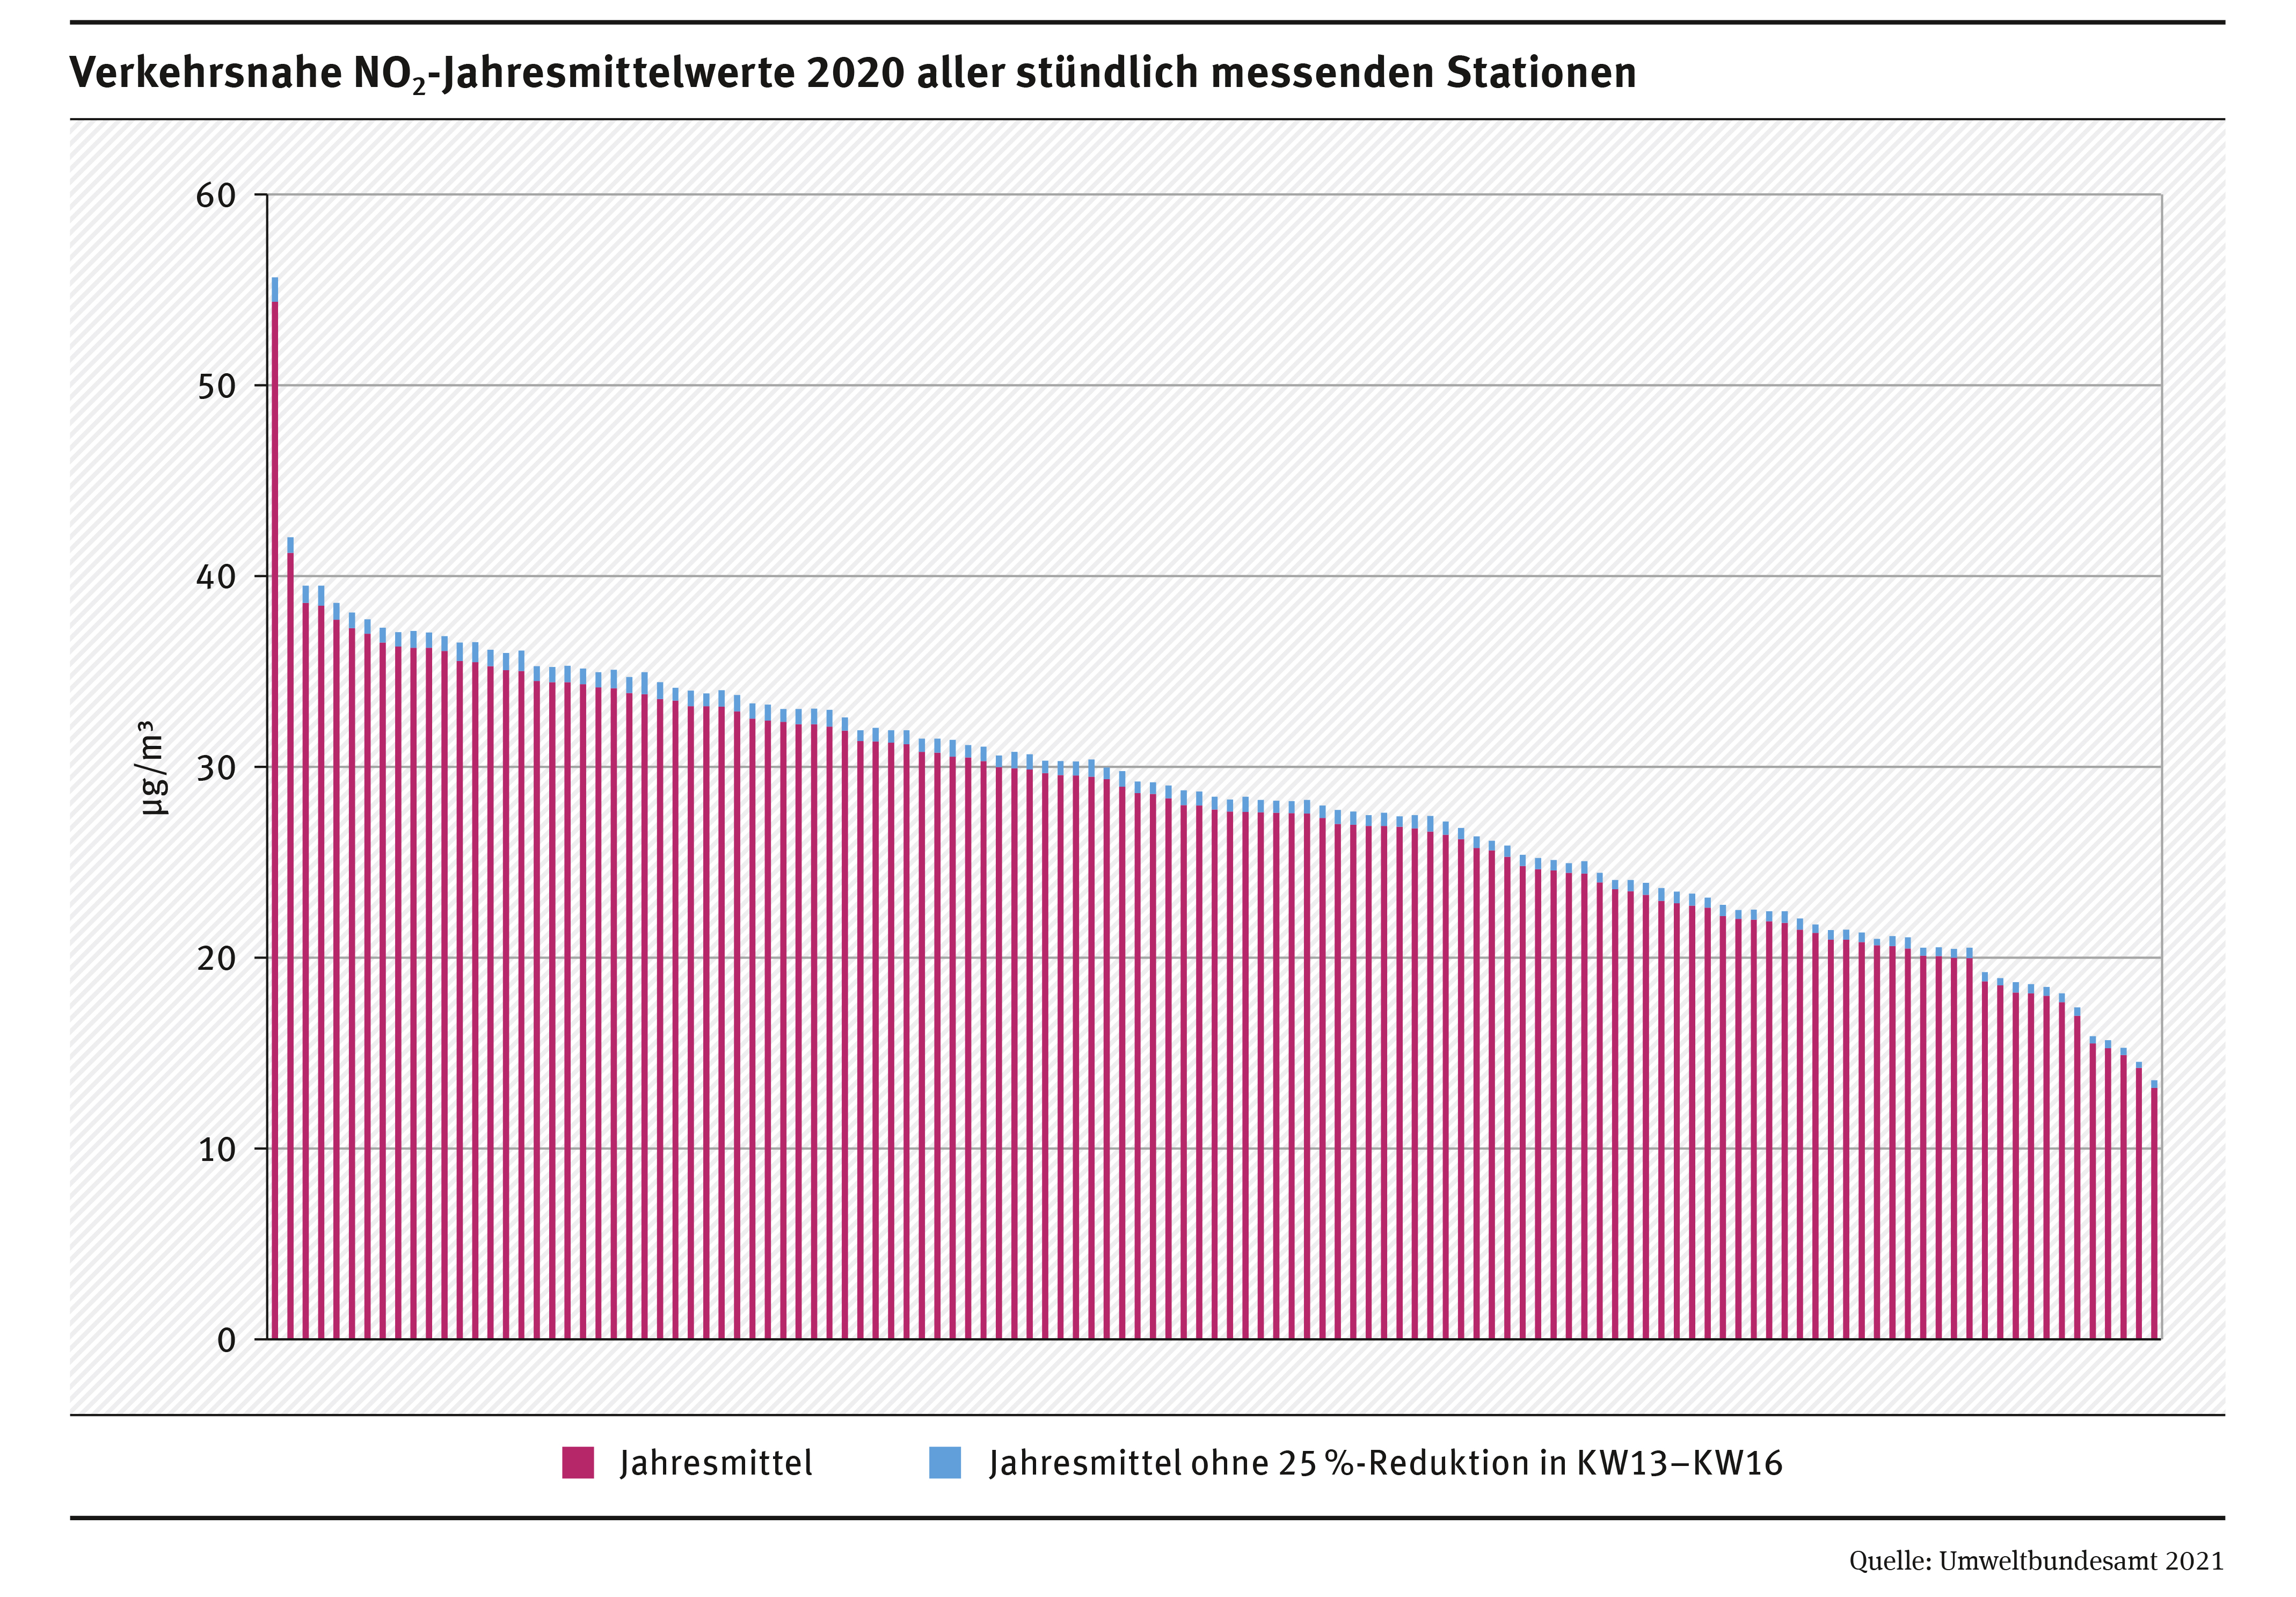
The following cities exceed the threshold: Munich (54 micrograms NO₂ per cubic metre of air (µg/m³)), Ludwigsburg (47 µg/m³), Limburg (44 µg/m³), Stuttgart (43 µg/m³), Darmstadt (42 µg/m³) and Hamburg (41 µg/m³).
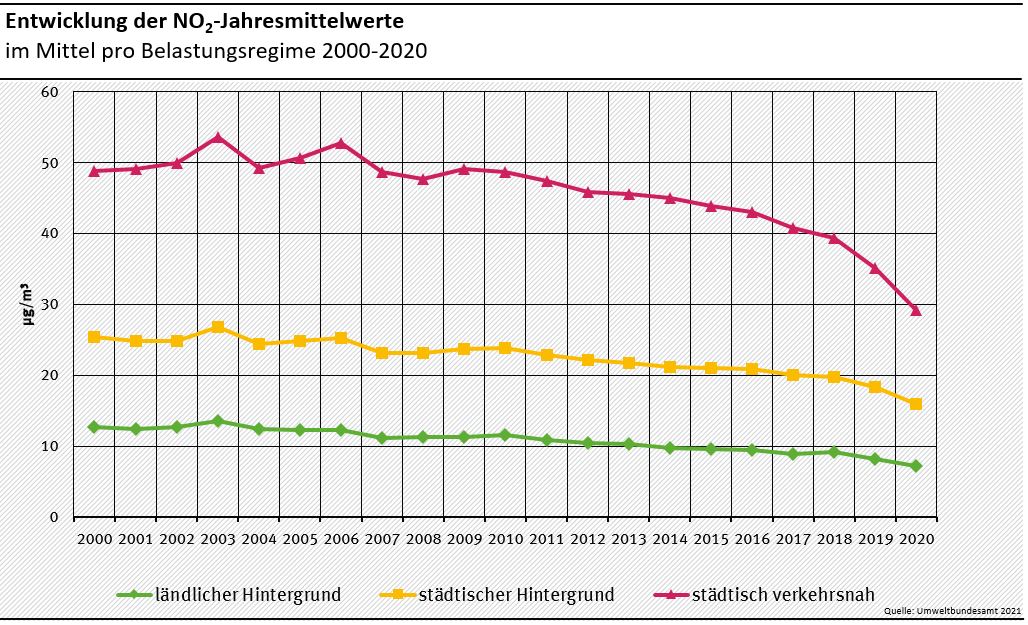
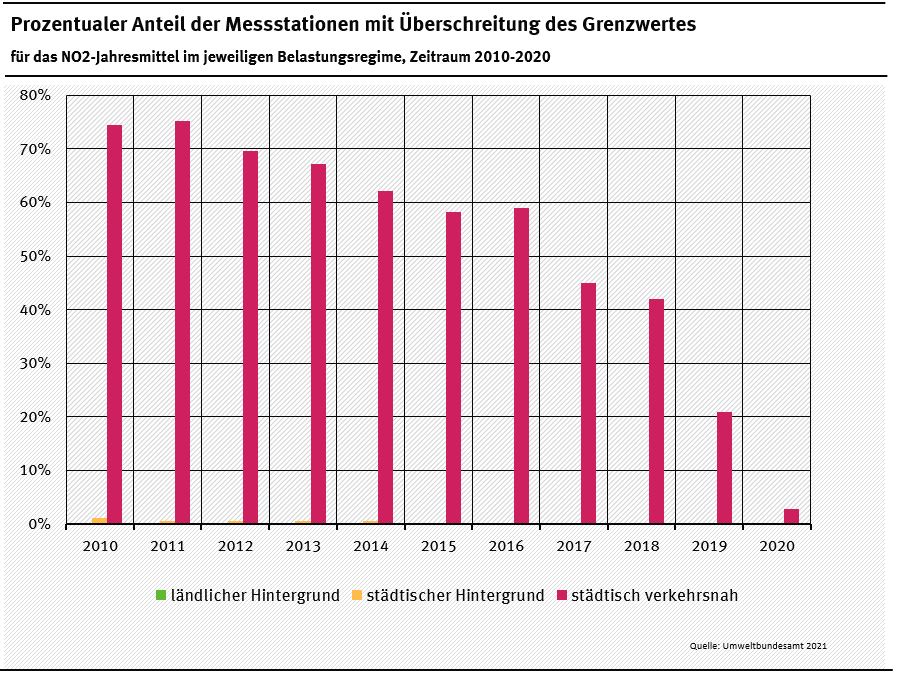
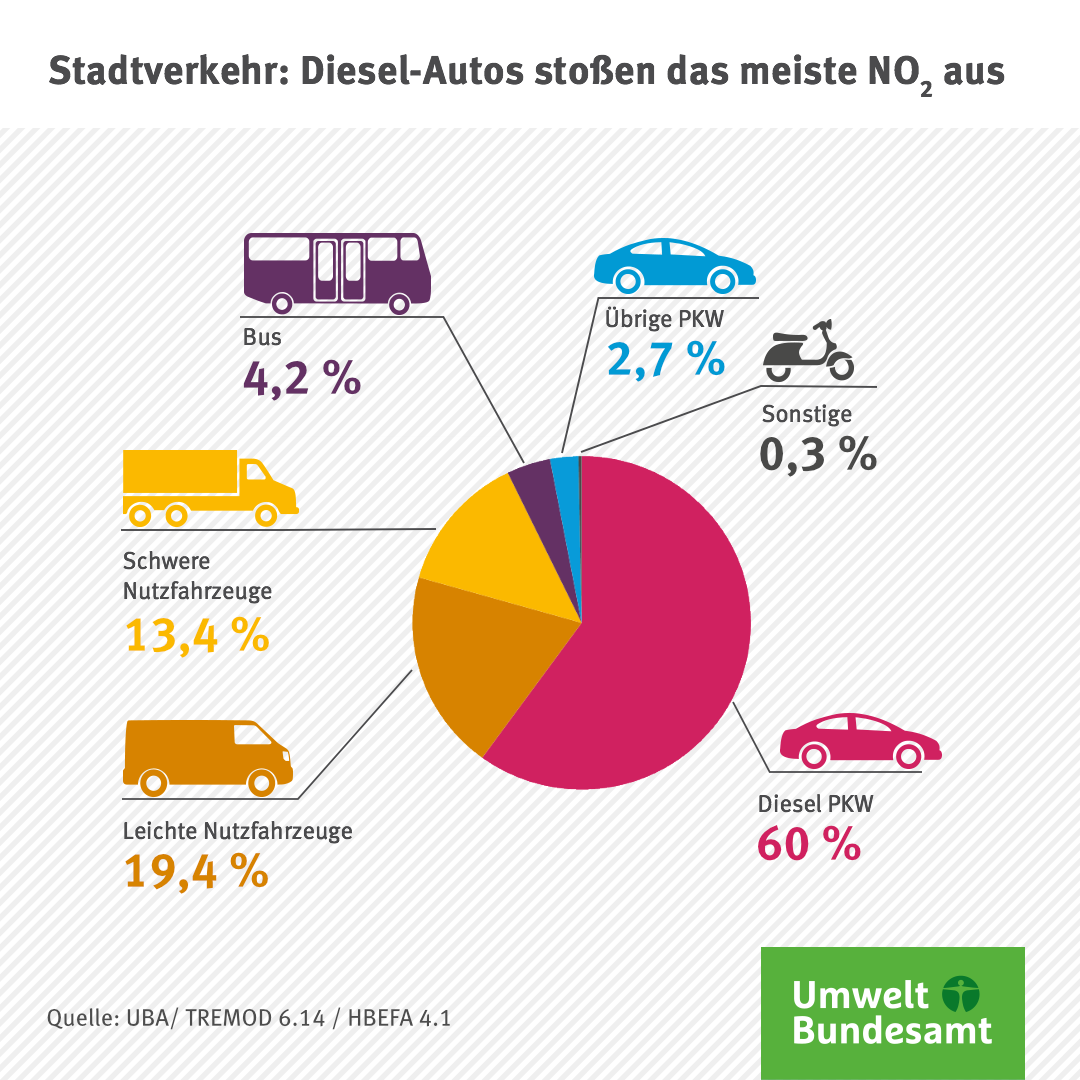
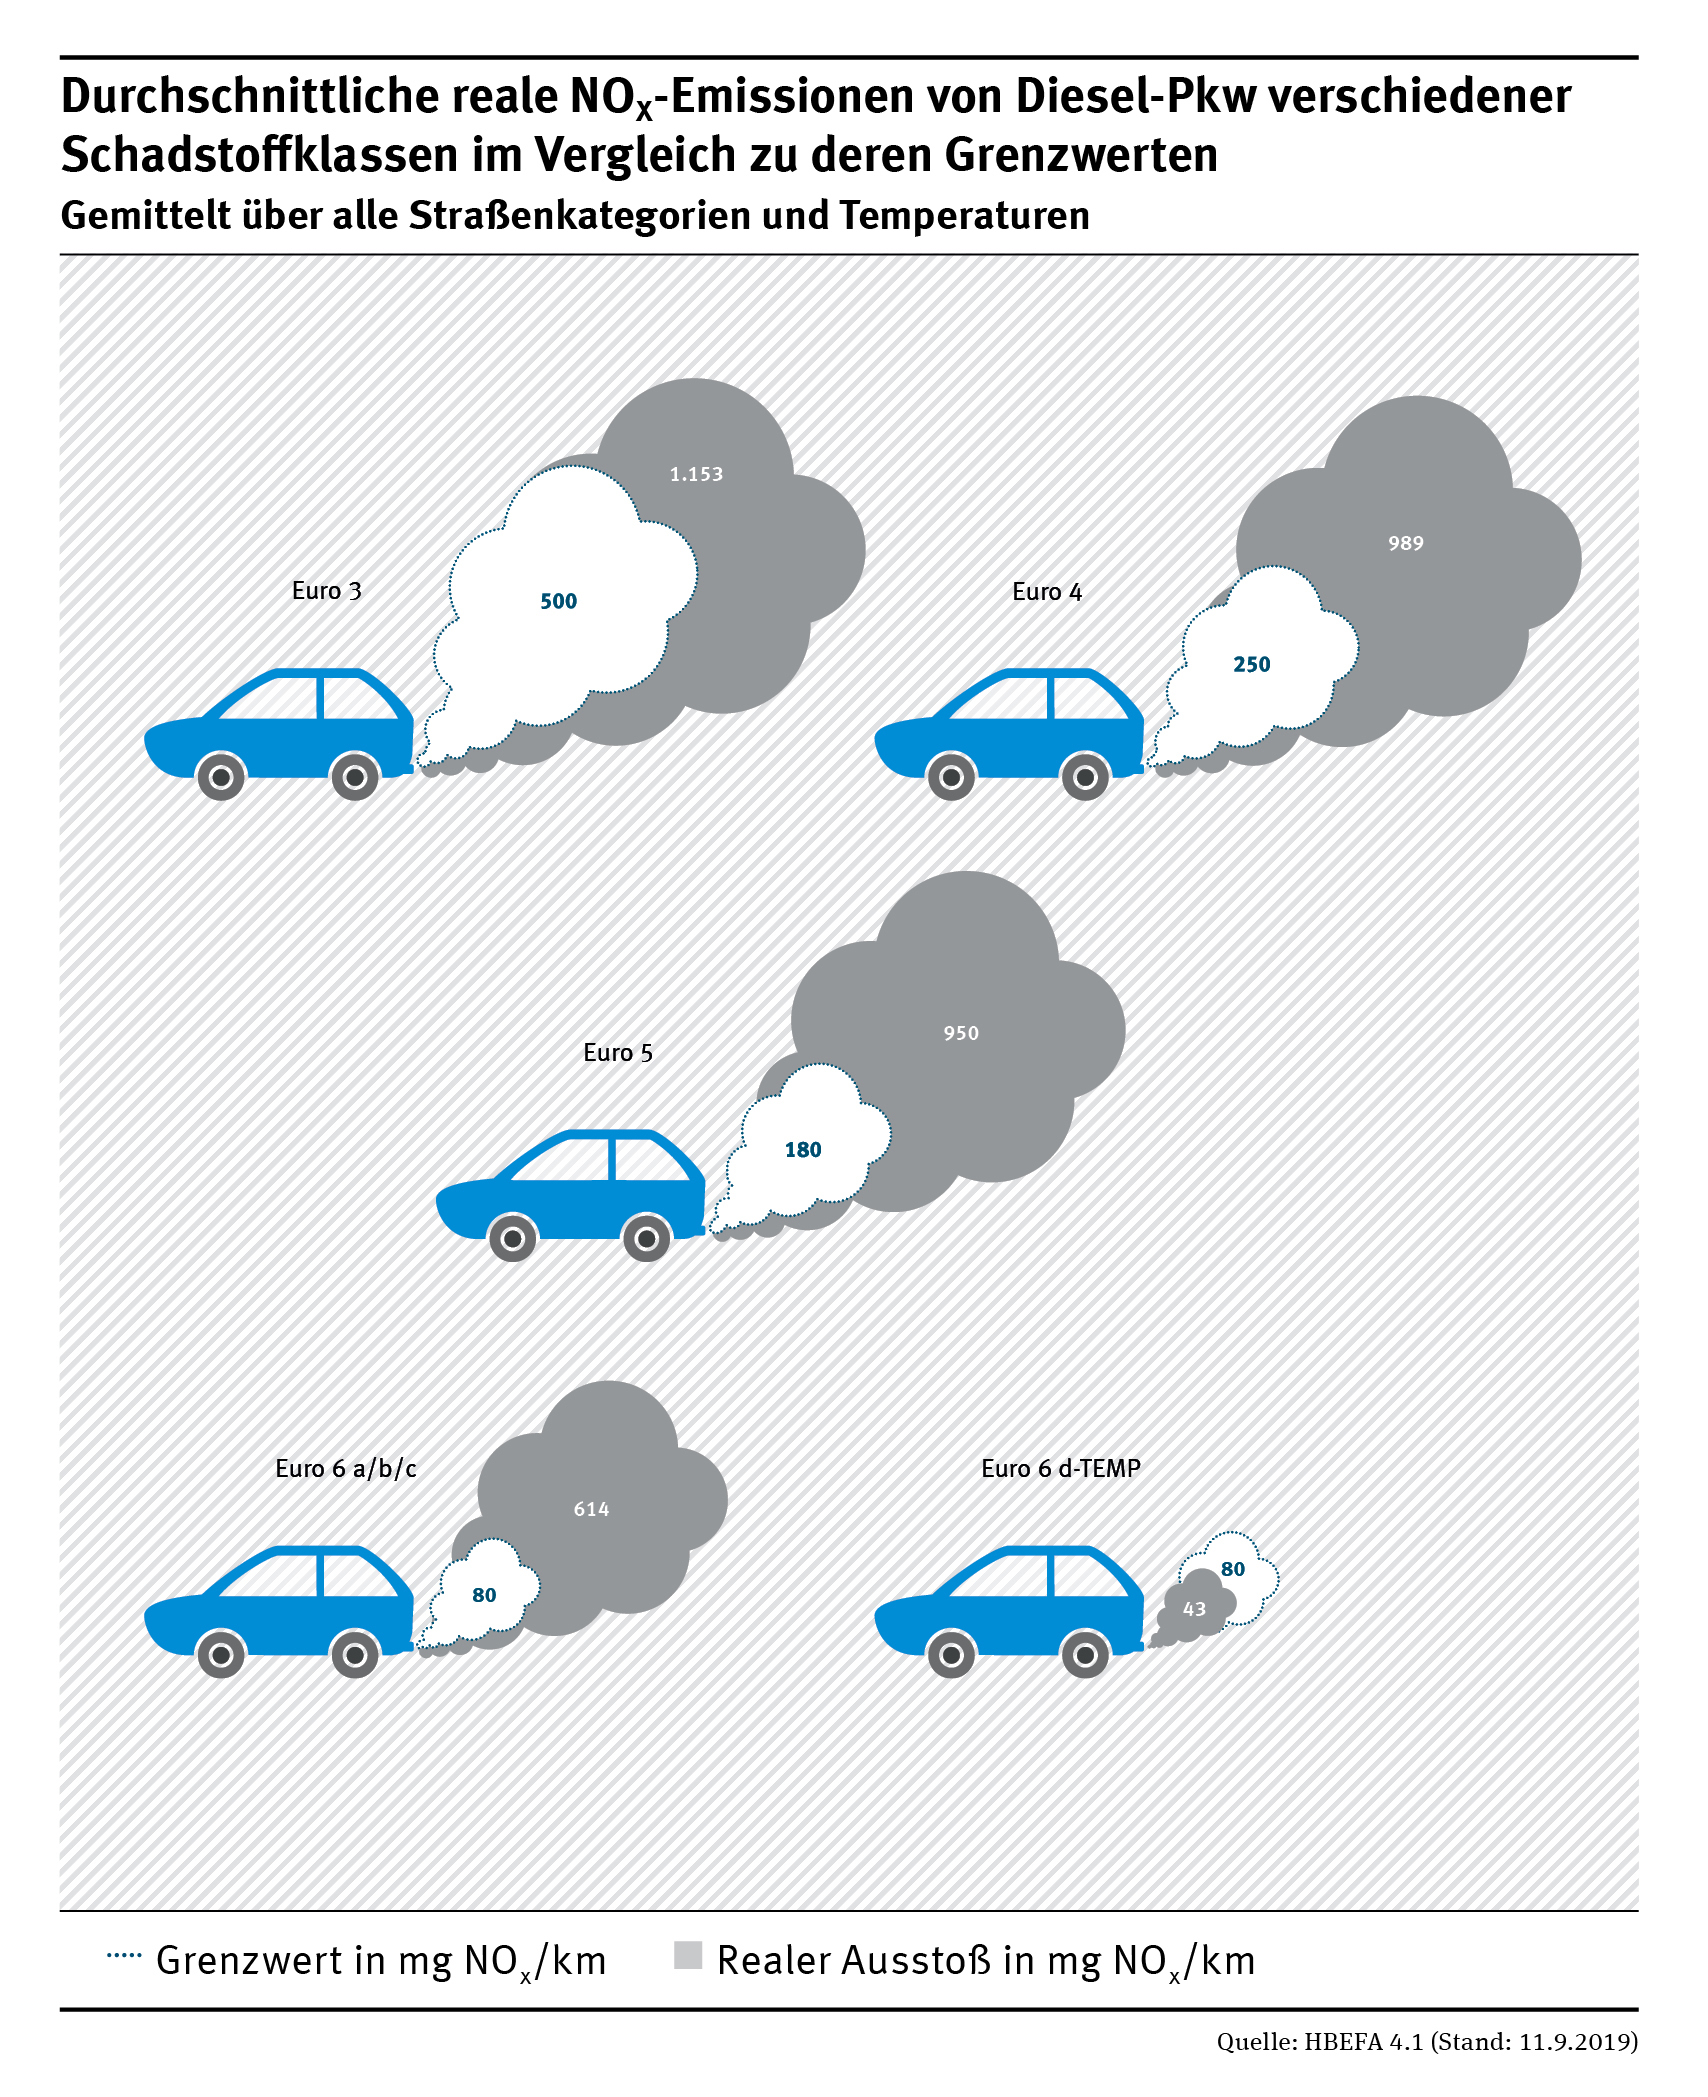
The main source of nitrogen oxides in cities is road traffic and diesel cars in particular. Exceedances of the NO₂ limit value therefore occurred and still occur exclusively on busy roads in conurbations and cities. In 2020, NO₂ concentrations exceeded the annual mean limit value of 40 µg/m³ at seven of the total of 250 measuring stations close to traffic. In 2019, this was the case at 51 measuring stations.
On the whole, the downward trend in NO₂ pollution in cities has continued. On average, the NO₂ values (annual mean values) at measuring stations close to traffic were more than four micrograms per cubic metre lower than in 2019. The decreases vary depending on the individual measuring stations. In addition to software updates and the annual renewal of the vehicle fleet, local measures such as speed limits, driving bans or the use of lower-emission buses have weather effects that favour or worsen the spread of air pollutants. To a lesser extent, the measures taken to contain the coronavirus pandemic also contributed to this decrease. Their impact was on average about one microgram NO₂ per cubic metre of air or less, although the values can vary greatly from station to station.
Stay updated on air quality
UBA launched the air quality app in 2019 which allows users access to the latest information on air quality. An expanded version of the app has recently become available. It now also contains index maps for each pollutant, displaying the pollution levels across Germany at a glance. The index maps are available for the current day, for the past and, for ozone, also as a forecast for the coming days. In the coming summer months, the ozone forecast will provide information on the expected ozone pollution as usual and automatically warn of increased values.
The data shown in the app for the whole of Germany from the more than 400 air monitoring stations come mainly from the monitoring networks of the federal states. The air quality index, which ranges from "very good" to "very poor", provides information at a glance about the air quality at each station. Depending on the level of pollution, the app gives health tips for outdoor activities. You can also set the app to receive warnings in order to be informed quickly in the event of poor air quality. The app is free of charge and free of advertising and is available for the iOS and Android operating systems.
Note on the NO₂ data for 2020
The data for monitoring air quality in accordance with the requirements of the EU Directive are collected by the measuring networks of the federal states (Länder). Subsequent data deliveries or corrections from the state monitoring networks are accepted until the date of the official report to the EU Commission on 30 September 2021.