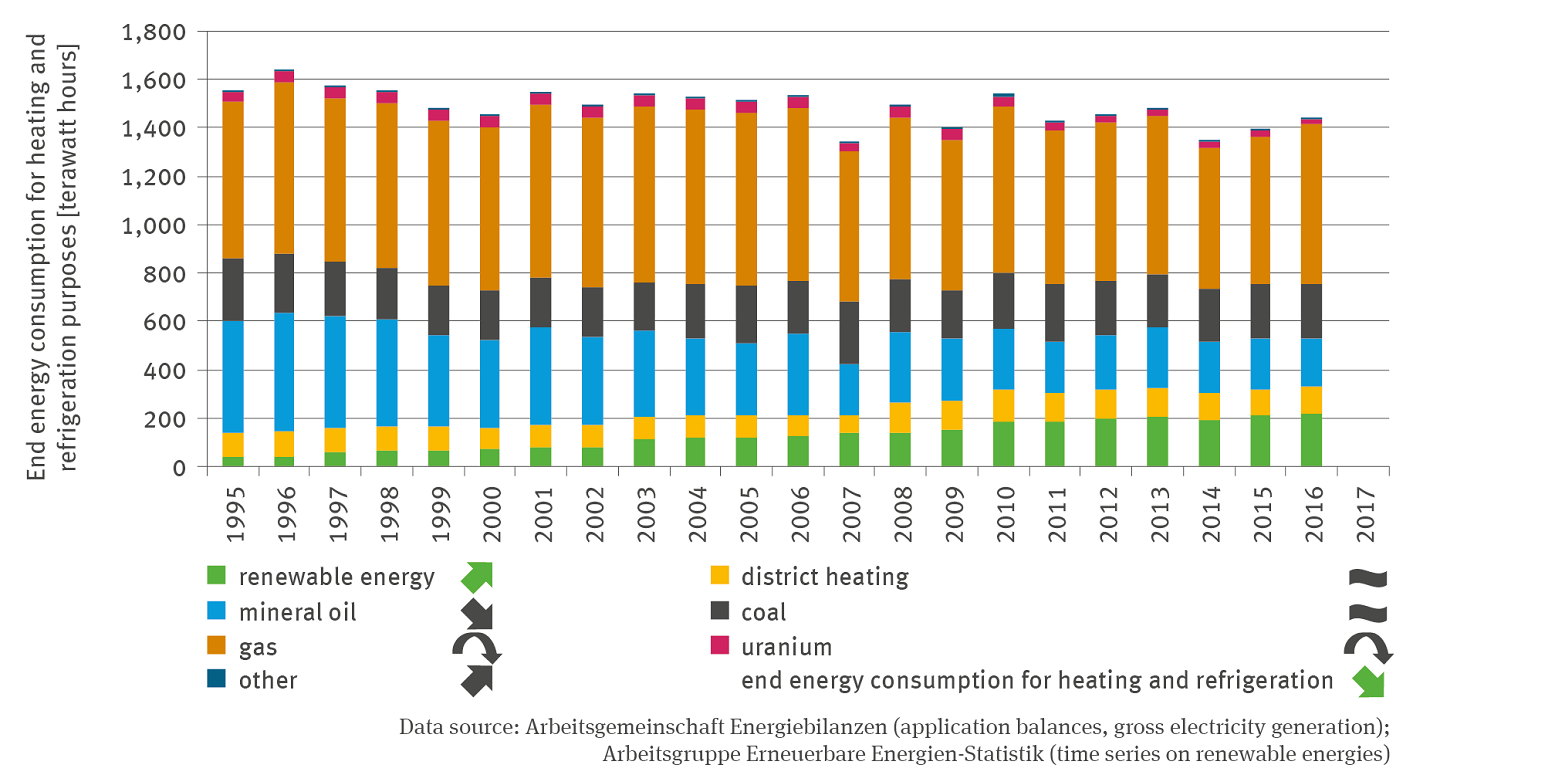
The stack column diagram shows the final energy consumption for heating and cooling in terrawatt hours in a time series from 1995 to 2016. The sum of the final energy consumption for heating and cooling fluctuates, but there is a significant downward trend. In 2016, consumption amounted to 1,441 terrawatt hours. The presentation is differentiated for renewable energies (rising trend), mineral oil (falling trend), gas (quadratic decreasing trend), district heating (no trend), coal (no trend), uranium (quadratic decreasing trend) and other (rising trend). Gas has the highest share, at 658 terrawatt hours in 2016. Renewables are increasing particularly significantly. In 2016, they reached 216 terrawatt hours.
Source: Arbeitsgemeinschaft Energiebilanzen (application balances; gross electricity generation); Arbeitsgrupe Erneuerbare Energien Statistik (time series on renewable energies)
Download image (176.62 kB)