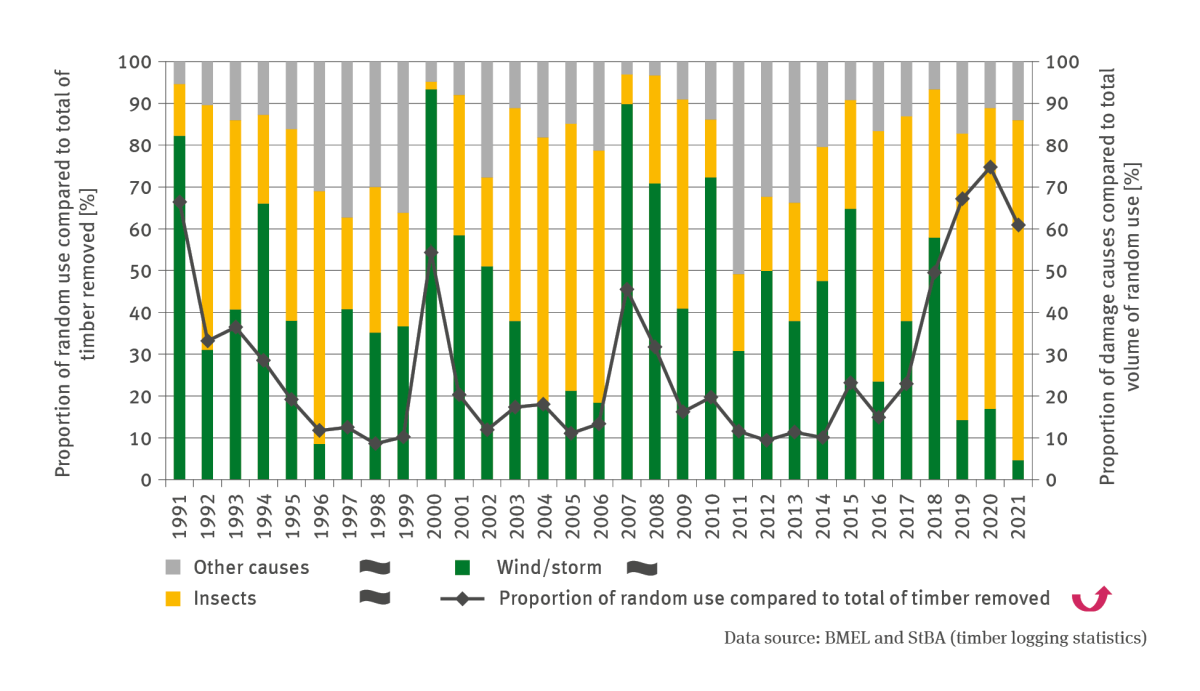
The illustration FW-I-5 ’Damaged timber – extent of random use’ contains a biaxial chart. The chart shows the proportion of random use compared to the logging total in per cent as a line, and the proportion of damage causes compared to the total of random use in per cent in terms of stacked columns. A differentiation is made between causes such as wind/storm, insects and other causes. The proportion of random use decreased steadily until the turn of the century, amounting to roughly 10 per cent in 1999.
FW-I-5: Damaged timber – extent of random use
Source: BMEL and StBA (timber logging statistics)image download

The following pages contain this image or document

The Umweltbundesamt

For our environment