
2023 Monitoring Report on the German Strategy for Adaptation to Climate Change read more
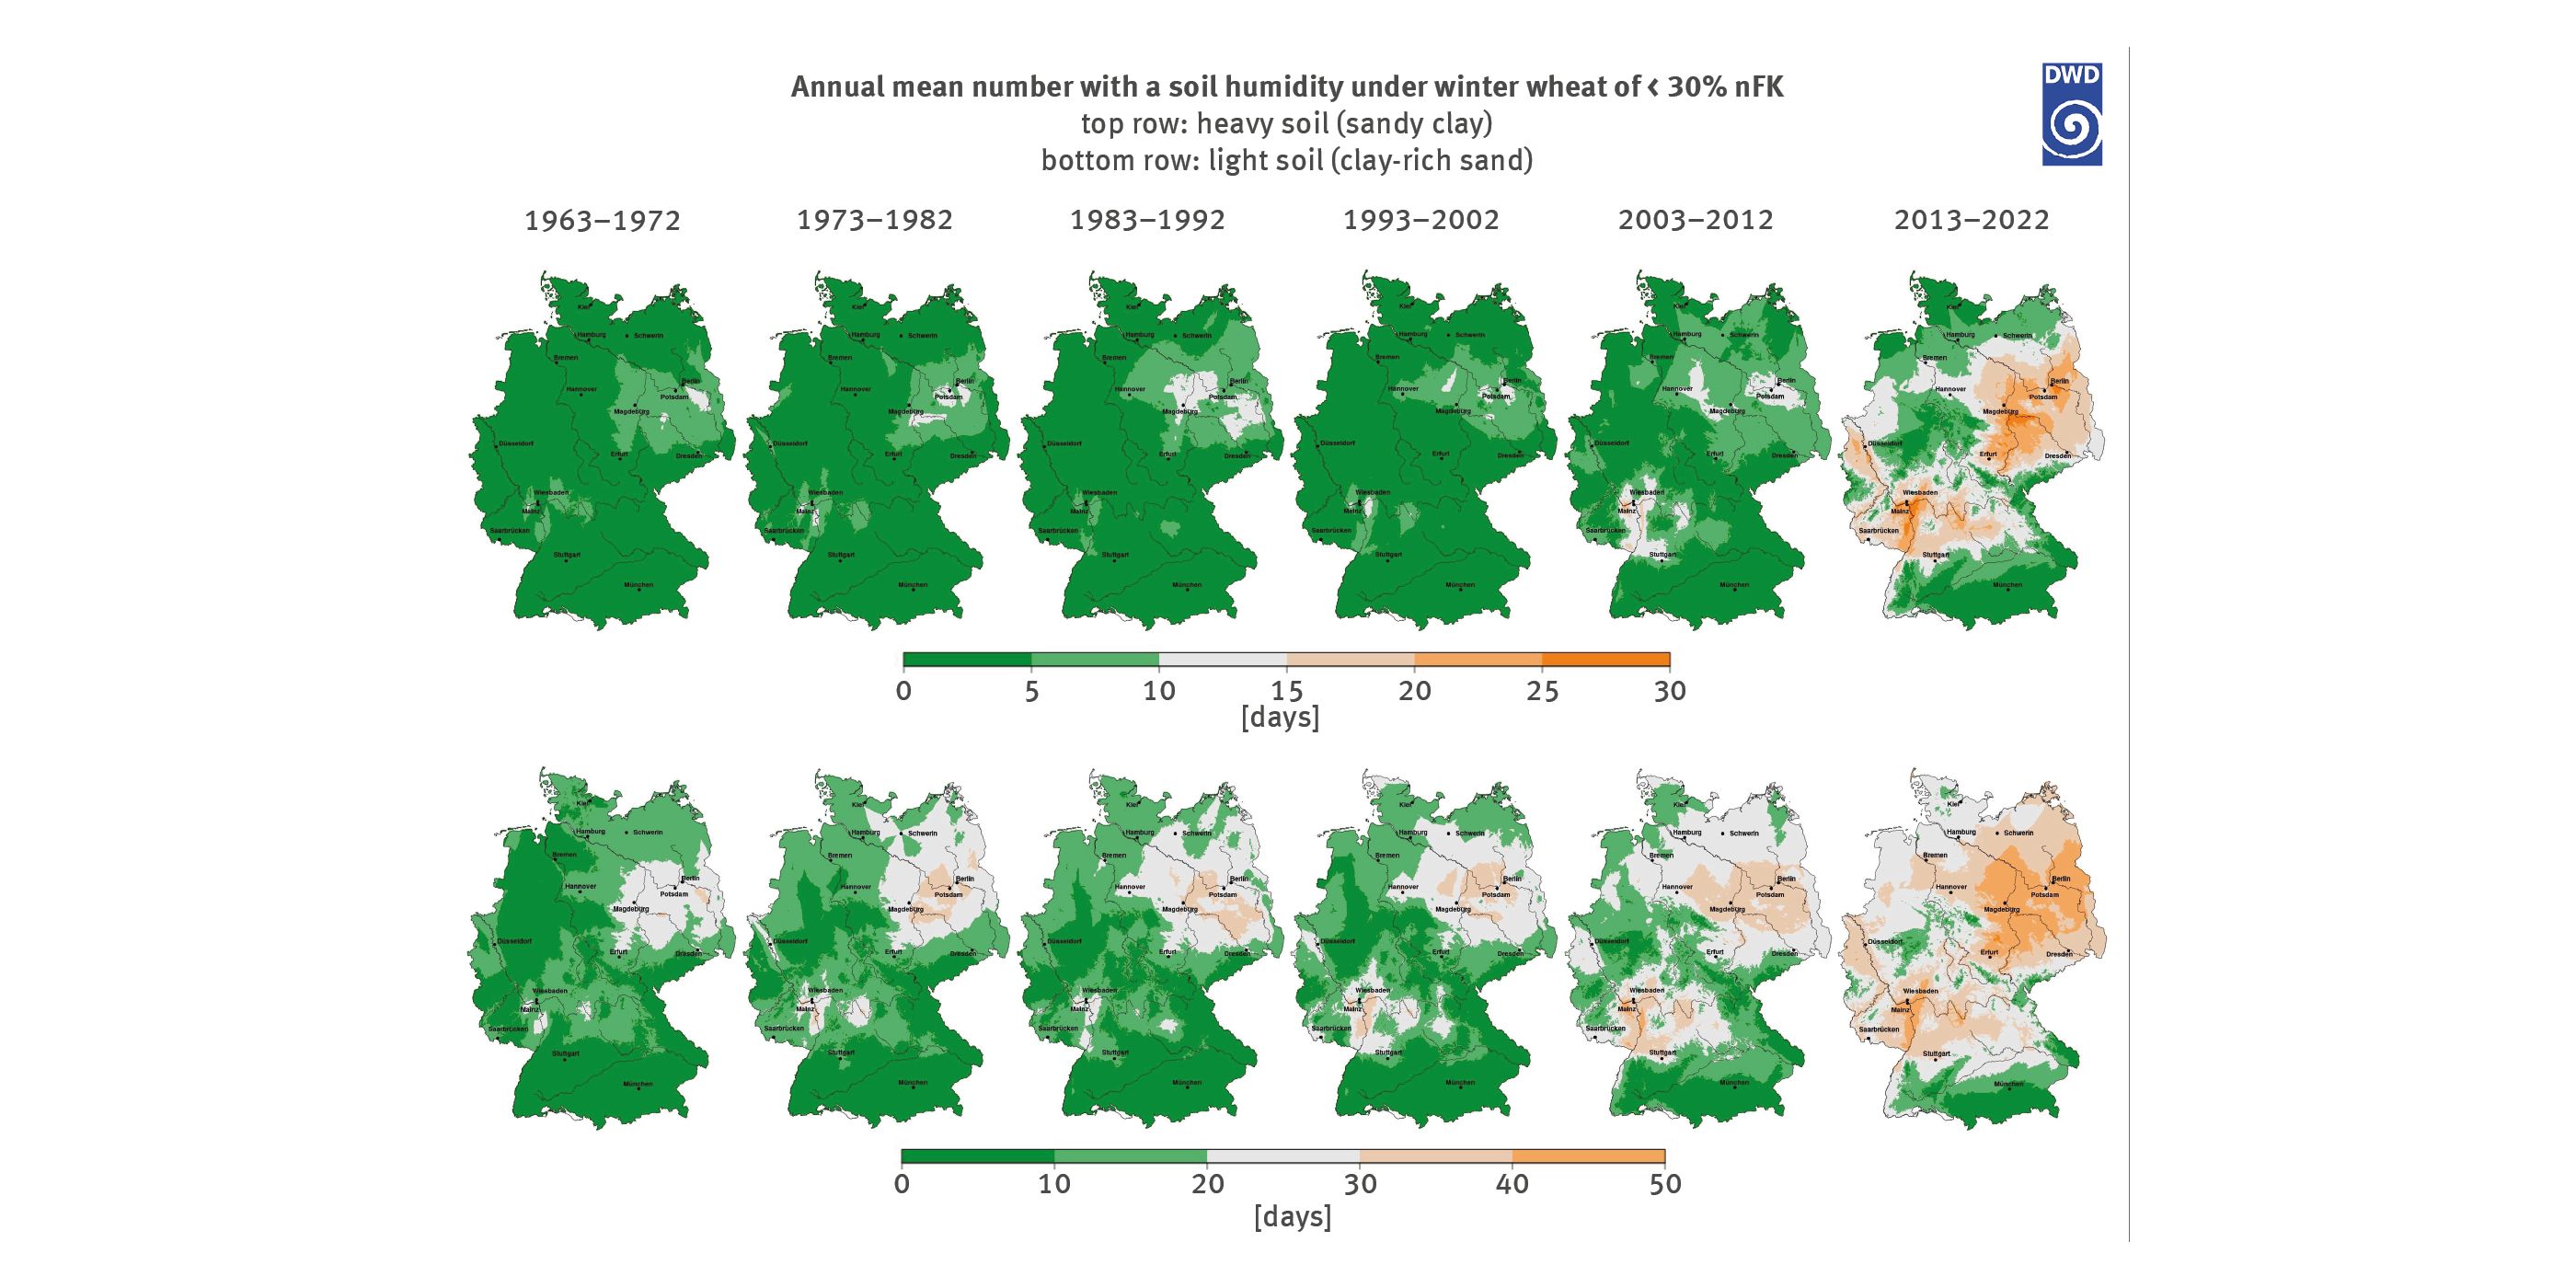
The chart consists of two rows of six nationwide maps each of Germany. The top row of maps shows the annual mean number of days with a soil humidity of less than 30 per cent usable field capacity for winter wheat on sandy clay, while the number of days in the bottom row refers to clay-rich sand. The six maps each cover the following periods: 1963–1972, 1973–1982, 1983–1992, 1993–2002, 2003–2012 and 2013–2022. The range for the top row is spread over 5 equidistant categories from 0 days (in shades of green) to the maximum of 30 days (in shades of orange). For the bottom row the range is spread over 5 equidistant categories from 0 to 50 days. Looking towards the right, the maps are increasingly dominated by shades of orange. There is a distinct focal area in the north-eastern part of Germany, and in later years, also in the Rhine area between Stuttgart and Frankfurt. In the bottom row of maps, the orange-coloured areas on the most recent map extend to almost the whole of Germany, except for the south of Bavaria and Baden-Württemberg, the Bavarian/Upper Palatinate forest, the Fichtel Mountains and the Erz Mountains on Germany’s eastern border as well as the western uplands where the areas are still coloured green.
