indicator

Umwelt-Indikator

Indicator: Employment in the renewable energy sector

Graph: After a strong increase since 2000, employment has been declining since 2012 due to the sharp job losses in solar energy. There was a slight increase from 2015 to 2016. Most jobs were created in the wind energy and biomass sectors. Between 2016 and 2019, there were sharp declines. By 2022, there were significant increases again, especially in solar energy and geothermal energy.

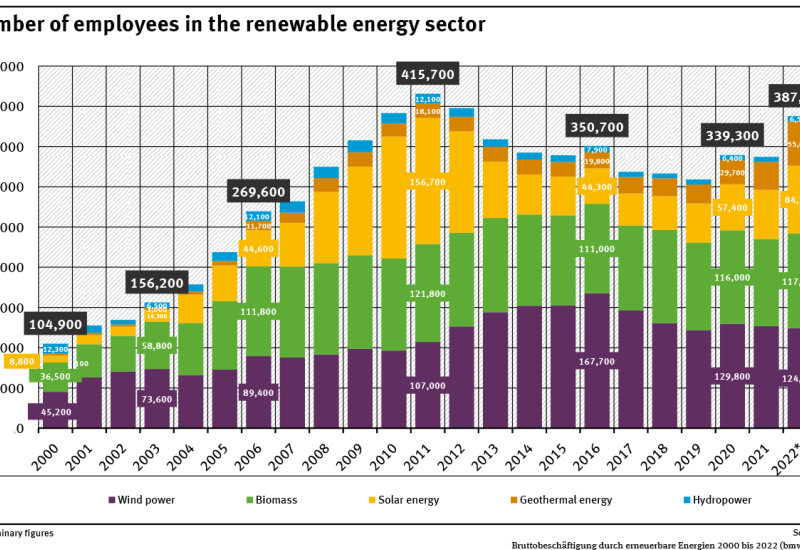
387,700 people worked in the renewable energy sector in 2022.Employment in the renewable energy sector reflects the development of the German market.Strong employment growth until 2011 was followed by a pronounced decline that resulted from the widespread collapse of the domestic photovoltaic industry.Only since 2019, employment has been rising again. read more

Indicator: Share of renewables in gross electricity consumption

A graph shows the share of renewable energies in gross final energy consumption. The share increased from 6.3% to 51,8% between 2000 and 2023.

Electricity accounts for around a fifth of the total final energy consumption. This share is set to increase in the future.The share of renewable energies in gross electricity consumption rose from 6.3 % to 51.8 % between 2000 and 2023.The German Renewable Energy Sources Act (EEG) stipulates that the share of renewable energies should increase to at least 80 % by 2030.If Germany achieves its ambit... read more

Indicator: Share of renewables in gross final energy consumption

A graph shows the share of renewable energies in gross final energy consumption. The share increased from 6.2 % to 22.0 % between 2004 and 2023.

Gross final energy consumption includes all types of final energy consumption by end consumers, primarily electricity, district heating, fuels and fuels for heat generation.So far, the development has been in line with the previous target of a 30 % share of renewables in 2030.However, as part of the new targets for the EU Renewable Energy Directive, the German target will soon be increased to 40 %... read more

Indicator: Greenhouse gas emissions avoided by renewable energies

A figure shows the trend for greenhouse gas emissions avoided by the use of renewables for power, heat and transport. 28 million tonnes of CO2 equivalents were avoided in 1990, and 250 million tonnes in 2023.

Renewables are increasingly replacing fossil fuels in the fields of electricity, heat and transport.More than ¾ of avoided emissions in 2023 were prevented by renewable electricity.The Federal Government intends to considerably expand the share of renewables to further reduce greenhouse gas emissions. read more

Indicator: Primary energy consumption

A graph shows primary energy consumption between 1990 and 2023 as well as the target value for 2030. Until 2008, the value fluctuated around 14,500 Petajoules, but has since fallen considerably.

Primary energy consumption (PEC) in Germany has fallen significantly since the end of the 2000s. It fell by 25 % between 2008 and 2023.According to the Energy Efficiency Act of 2023, PEC is to be reduced by 39% by 2030 compared to 2008.The 'Projection Report 2023' by the German Environment Agency indicates that the measures taken so far will likely be insufficient to achieve these targets.The indi... read more

Indicator: Greenhouse gas emissions

A graph shows the trend in greenhouse gas emissions in Germany, which fell from 1,251 million tonnes of CO2 equivalents in 1990 to 674 million tonnes in 2023. The bars are divided into different sectors. The graph shows all target values up to 2045.

According to initial calculations, greenhouse gas emissions in Germany declined by exactly 46.1 % between 1990 and 2023.Germany aims to reduce greenhouse gas emissions by 40 % by 2020 and by at least 65 % by 2030 compared to 1990 emission levels. Complete greenhouse gas neutrality is to be achieved by 2045.In 2023, Germany was well below the target of minus 40 % set for 2020. The targets for 2030... read more

Indicator: Emission of air pollutants

Graph: The development of emissions of five air pollutants and an overall index relative to the base year 2005 (=100%) can be seen. The trend of all substances decreases significantly, but ammonia only since 2014. The 2030 target (55%) seems within reach.

The averaged index of air pollutants fell by 34.4% between 2005 and 2022.The obligations of the Gothenburg Protocol and the NEC Directive for 2020 were achieved.Safely meeting the commitments of the European NEC) Directive for 2030, is a challenge for the German environmental policy.Ammonia emissions must continue to be significantly reduced to achieve this. read more

Indicator: Population exposure to traffic noise

A graph shows the proportion of people exposed to traffic noise above 55 decibels during the day and above 50 decibels at night, as observed in the 2022 noise mappings. It differentiates between road, aircraft and rail traffic noise.

According to the 2022 noise mapping, about 17.0 % of the total population was adversely affected by night-time noise.They further showed that 25.1 % of the population was exposed to a noise level of above 55 decibels during the day.The main source of noise is road traffic. Aircraft noise hardly plays a role in the area assessment.Noise that exceeds exposure limits can lead to health problems. read more

The Umweltbundesamt

For our environment