Maps and CCE Data
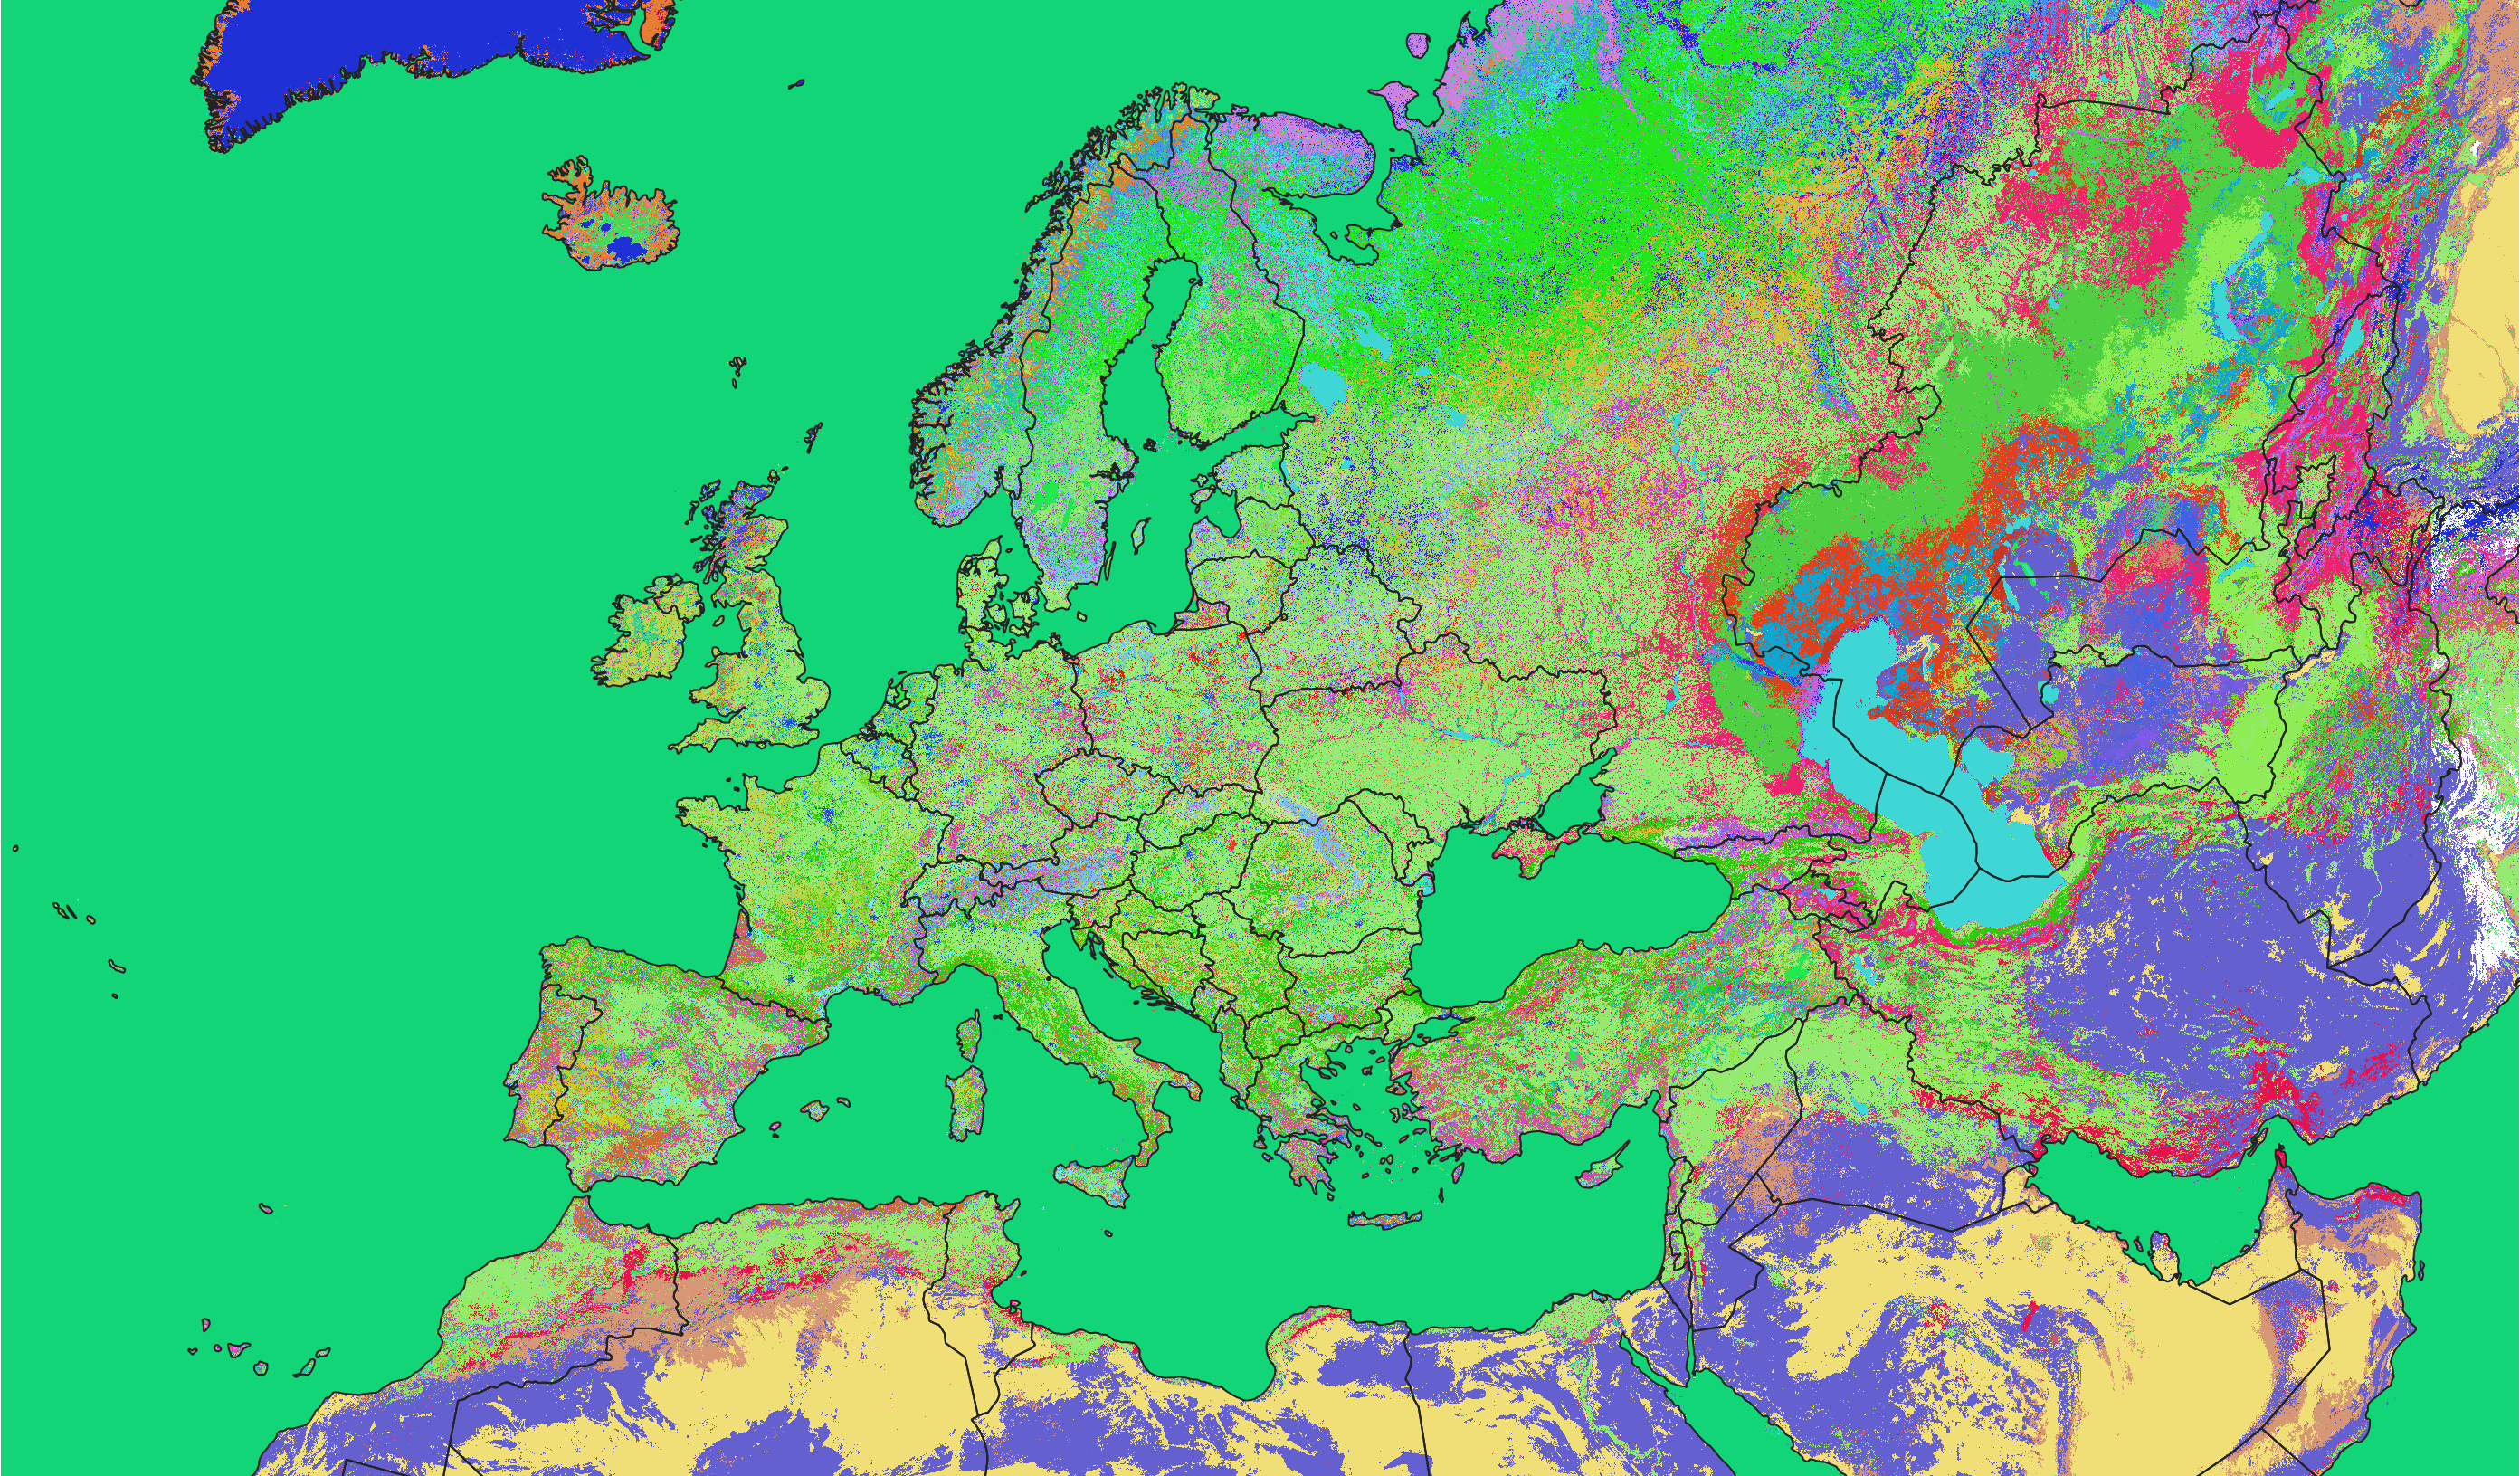
Receptor Map
Source: CCE
Maps are created/updated using CL data from the NFC.
Receptor Map
Source: CCE
Maps are created/updated using CL data from the NFC.
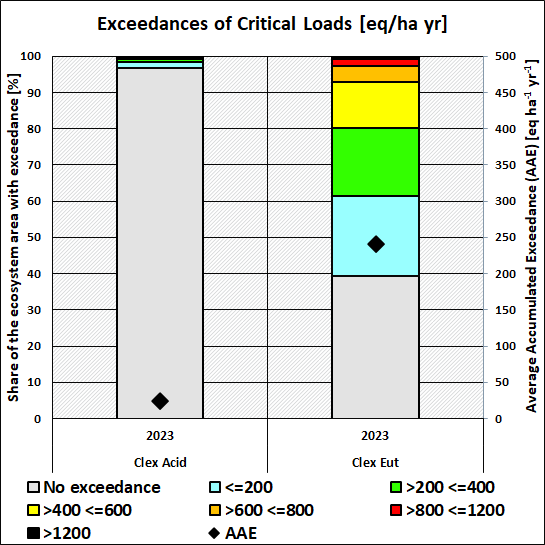
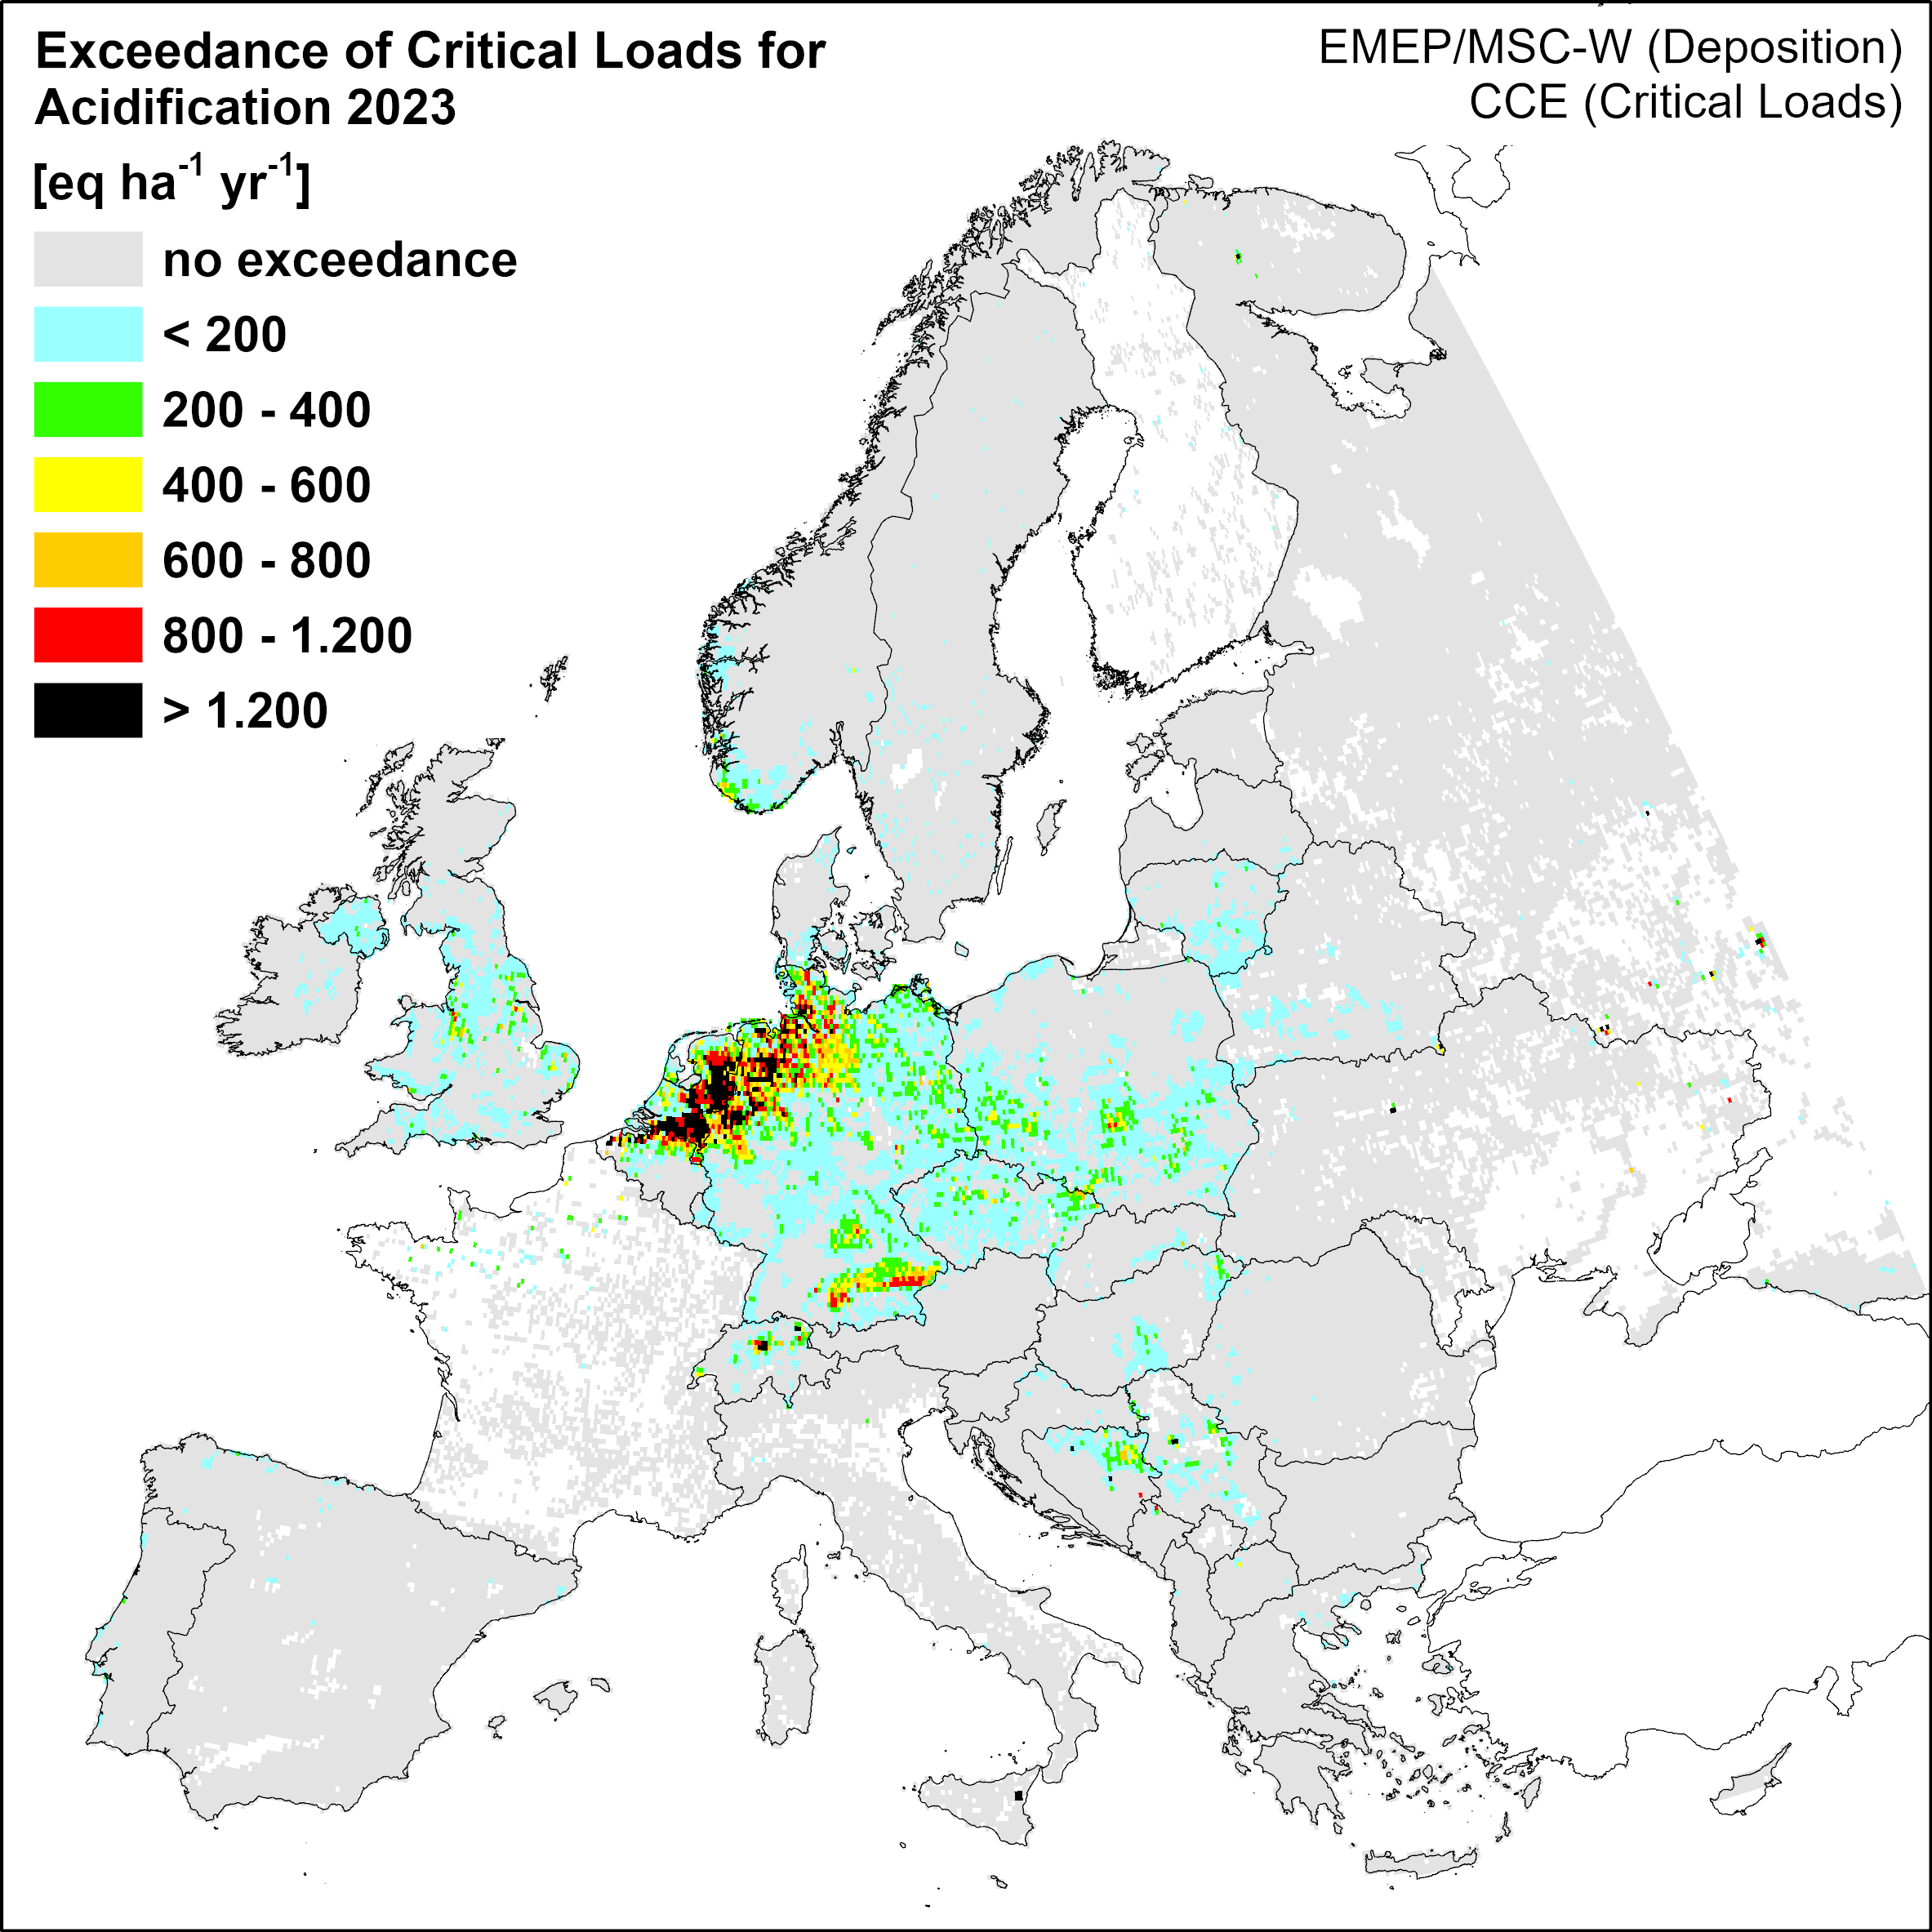
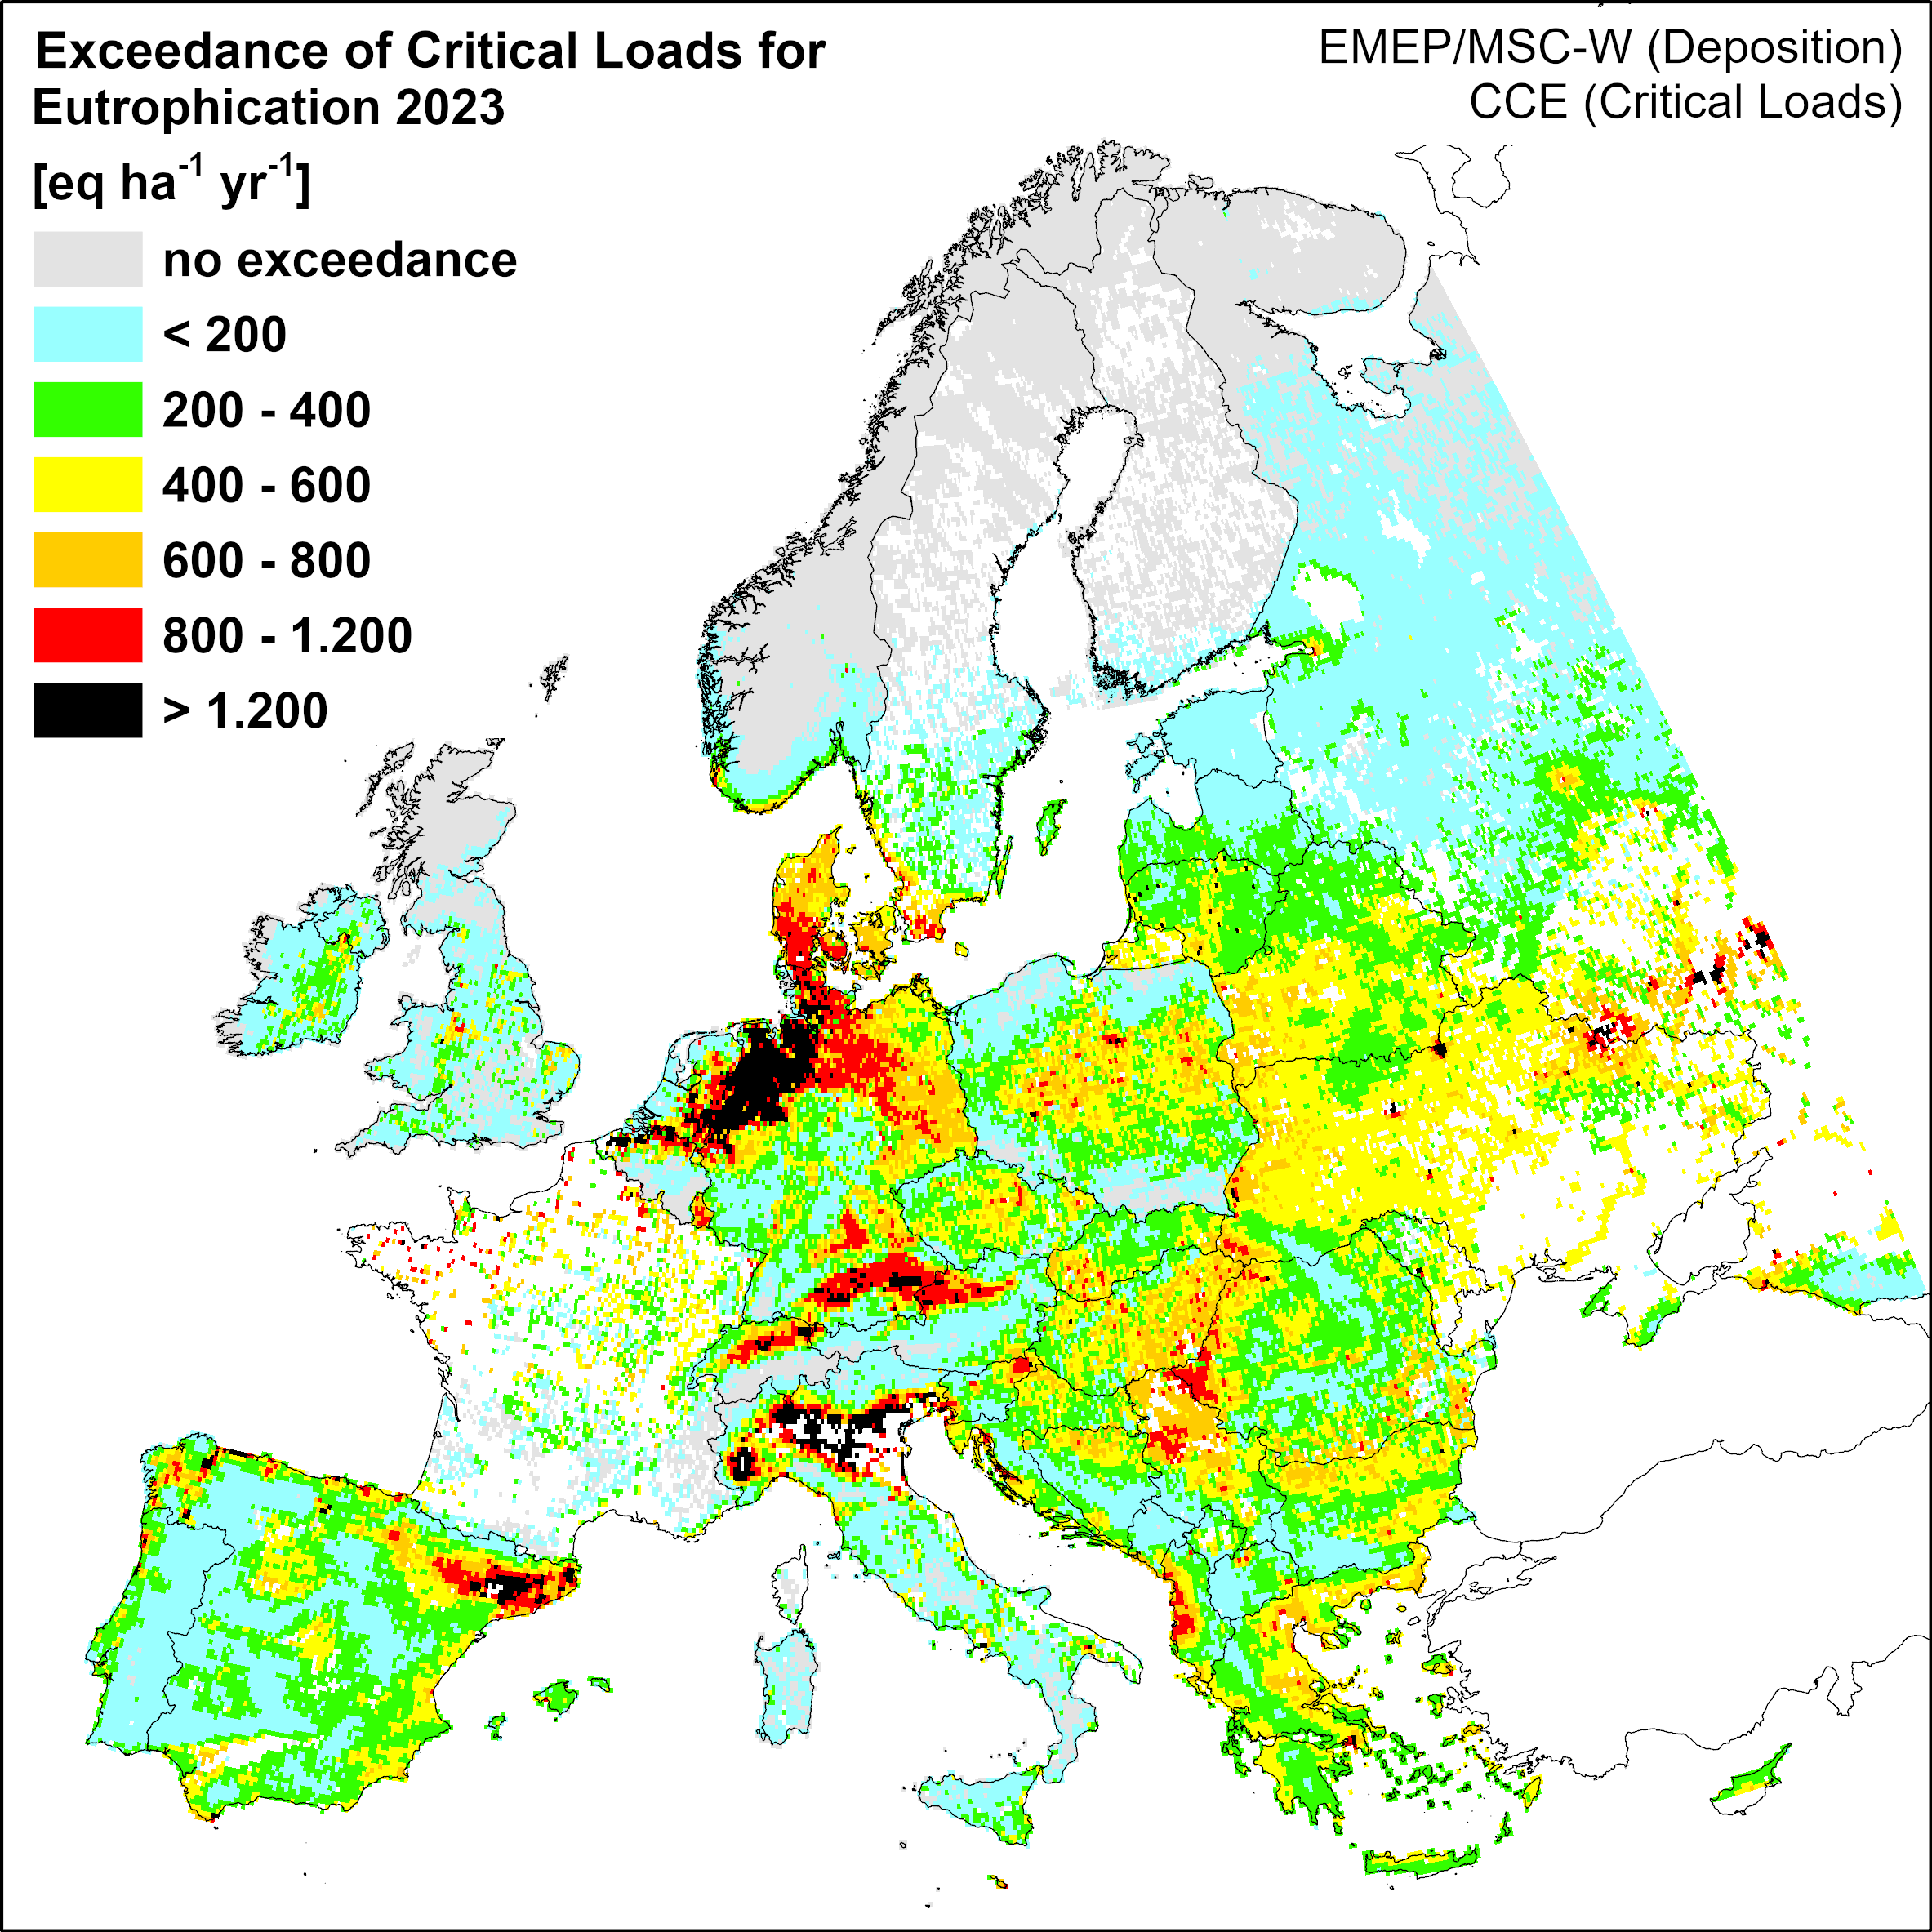
The mandate of the CCE is to develop and update methodologies for assessing critical loads (CL), to compile data on CL and to generate maps of CL and their exceedances. In the context of integrated assessments performed by the CLRTAP under the Gothenburg Protocol, ecosystem-specific critical loads (CL) of acidity and of nutrient nitrogen and respective CL exceedances are deployed to assess cost-effective solutions for emission abatement. Furthermore, exceedances of CL for eutrophication are also used as an indicator in other frameworks of nature protection such as the EU biodiversity strategy (EEA headline indicator). The CCE is responsible for the coordination of the technical work regarding CL reporting and corresponding methodological developments under ICP M&M. To this, CCE develops and implements databases for the calculation of CL, their exceedances and their mapping at the spatial scale of the convention parties in close cooperation with National Focal Centres (NFC). The work of the CCE also includes the assessment of CL exceedances calculated from CL values of national data, the updated European CL background database and modelled historical and projected deposition values of the EMEP Meteorological Synthesizing Center (MSC) West depending on past emissions and emission scenarios for 2030 to 2050.
The UBA’s motto, For our environment (“Für Mensch und Umwelt”), sums up our mission pretty well, we feel. In this video we give an insight into our work.
Due to the large number of enquiries, there may be delays in responding. We ask for your understanding.
